How to Maintain a Current Network Inventory in SolarWinds
Working with our customers, we constantly observe that a scheduled network discovery is not configured, or that it was run probably the first time SolarWinds® Orion® was installed. Subsequently, a common grievance is missing devices, interfaces and volumes that is skewing alerting, dashboards, and reports. This is especially true of hybrid networks, that rely on virtual infrastructure, wired and wireless networks, and cloud resources. This can quickly complicate network topology and make it difficult to identify the root cause of an issue and, diminish trust of alerts, dashboards and reports.
Maintaining a current network inventory is essential for accurate monitoring, configuration management, capacity planning, and security.
In previous blogs, we have discussed other dimensions to automating/maintaining a current network inventory. In this blog, we’ll be looking at Orion features that can be leveraged in ‘Discovery Wizard’ to run a scheduled discovery. Also go over how to create a report to give you visibility on stale nodes, interfaces and volumes.
Network Discovery (Network Sonar Discovery)
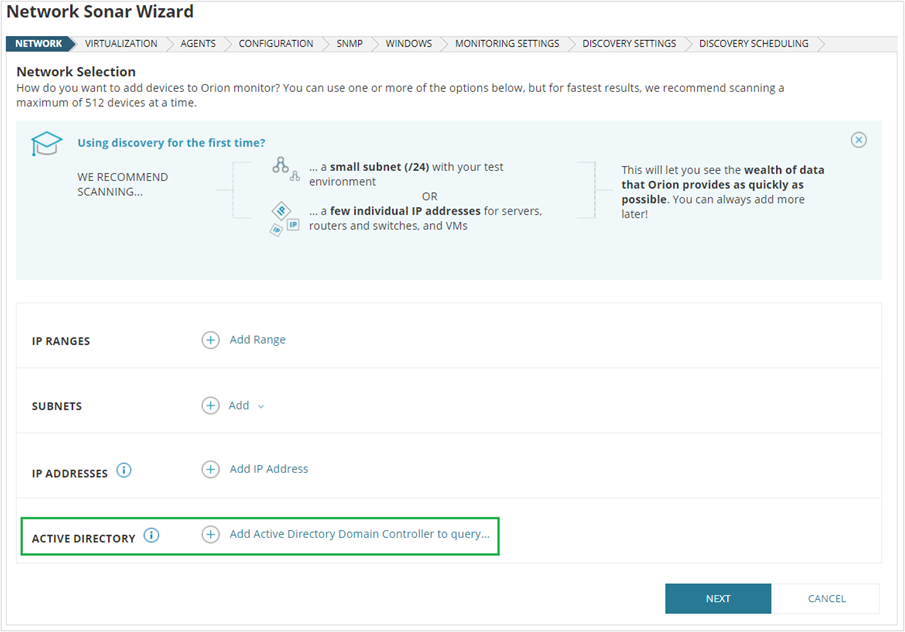
Utilizing Active Directory to target a lot of servers instead of scanning every IP address in a range.Start by adding a new discovery or edit an existing discovery.
Click on ‘Add Active Directory Domain Controller to query’.
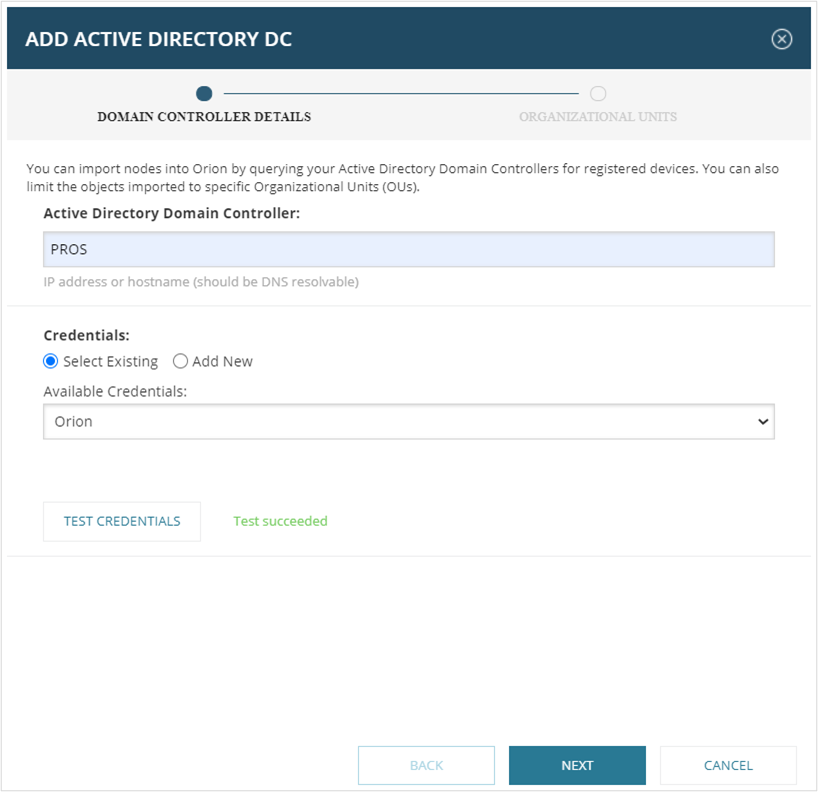
Fill in the IP/name of the Domain Controller and, select the appropriate credentials if they already exist in Orion. If not, add those credentials. Click on ‘TEST CREDENTIALS’.
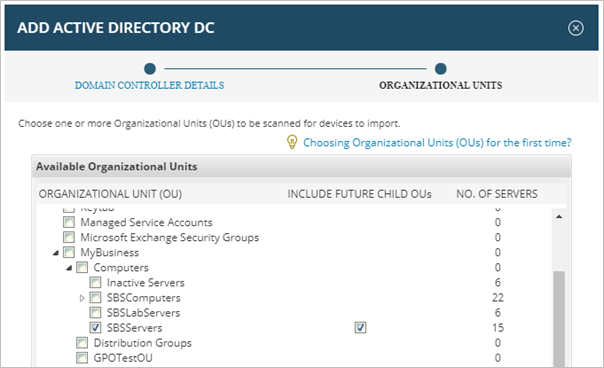
You are presented with the Organizational Unit (OU) tree. Select the appropriate OUs and, you have the option to exclude PCs.
Upcoming Webinar: The Power of SolarWinds Customisation – Advanced SolarWinds Reports
When providing credentials for Network Device Configuration Management (NCM module), SNMP and Windows, it is best practice to include those relevant credentials only to avoid a lengthy discovery.
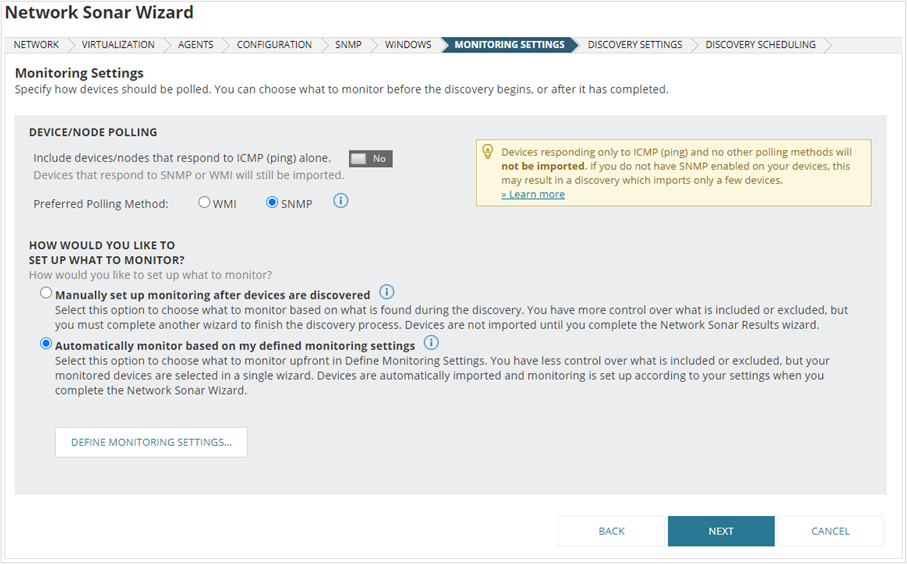
Automatically monitor based on my defined monitoring settings
By opting to ‘Automatically monitor based on my defined monitoring settings’, allows you to define what to include and exclude in the discovery results and will automatically import discovered devices, without the need to visit ‘Scheduled Discovery Results’.
Click on ‘DEFINE MONITORING SETTINGS…’
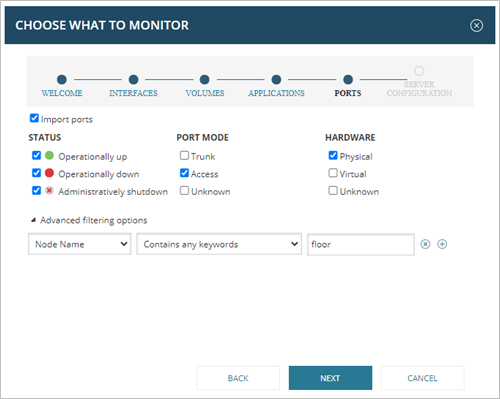
Depending on the installed modules and what you are trying to discover, select appropriate objects. In this example, we are discovering access layer switches. That means we are not interested in monitoring availability and performance of interfaces with port mode ‘Access’ and, we can ignore loopback and null interfaces.For ‘Ports’, part of the UDT module, we’re concerned only with nodes that contain ‘floor’ in their name and, all physical interfaces with ‘Access’ mode and regardless if those interfaces are up, down or shutdown.
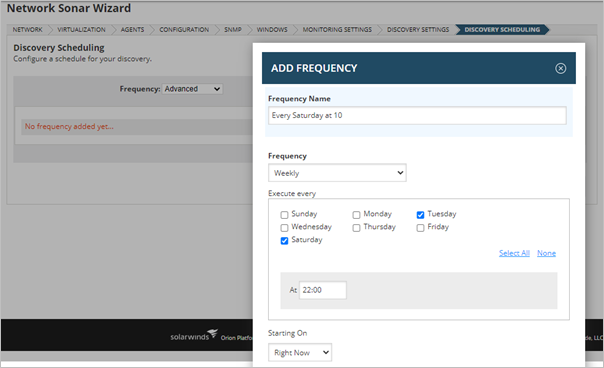
Assign a simple frequency to the discovery or, you are able to specify a specific schedule.
Segmenting a discovery into several Discovery Profiles gives you the ability to be selective about what to monitor and, decreases the amount of time each job runs. For larger environments, consider dividing discovery jobs by Credentials, IP address range, Latency and Polling Engine.
A scheduled network discovery will keep your inventory updated with any newly provisioned devices, interfaces and volumes. The other side of the coin that will need to be addressed is when interfaces or volumes are removed/deleted or, nodes are retired. Those objects still exist in Orion but now they are unresponsive and over time their data becomes obsolete.
If there isn’t a mandate to keep this data, it is recommended to remove these objects, which will remove associated data, so when alerts are being evaluated, a dashboard presenting status/stats, or running a report, SolarWinds Orion is processing only applicable data. This will also give you control over Orion’s database growth, and required to compute resources on Orion servers.
Stale Interface and Volume Retention Settings
For interfaces and volumes, Orion is able to recognise “stale” interfaces and volumes when no data is polled for a specified time, as defined under Polling Settings.
Enable ‘DELETE STALE INTERFACES’ and set ‘STALE INTERFACE RETENTION’ to 14 days.
Enable ‘AUTOMATICALLY REMOVE UNKNOWN VOLUMES’ and set ‘REMOVE UNKNOWN VOLUMES AFTER’ to 14 days.
We’ve learned most customers find 14 days is appropriate to enable automated maintenance of interfaces and volumes inventory.
You need to restart the Business Layer whenever you change these settings.
SolarWinds Orion does not have similar settings for nodes but, we are able to flag those stale nodes using reports and simultaneously, provide visibility on stale interfaces and volumes.
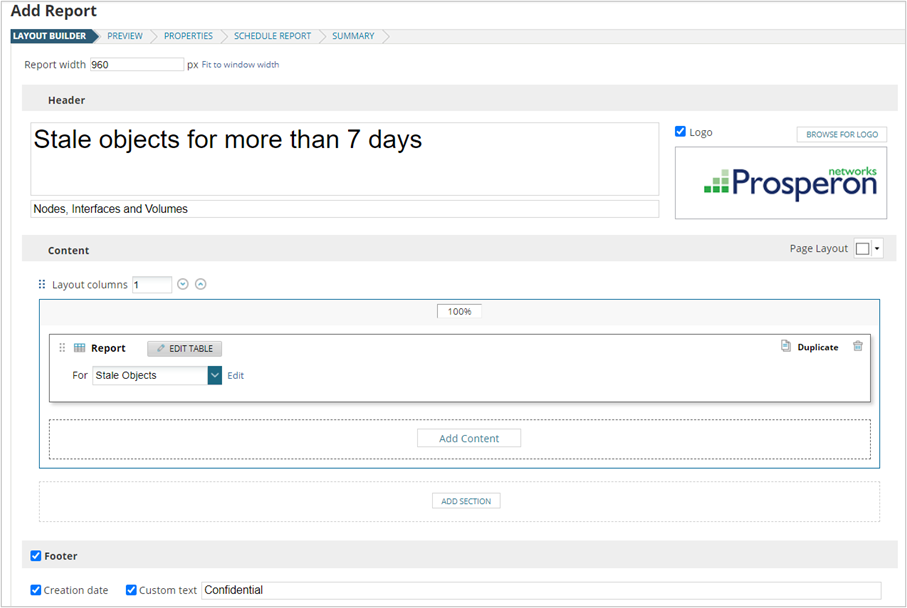
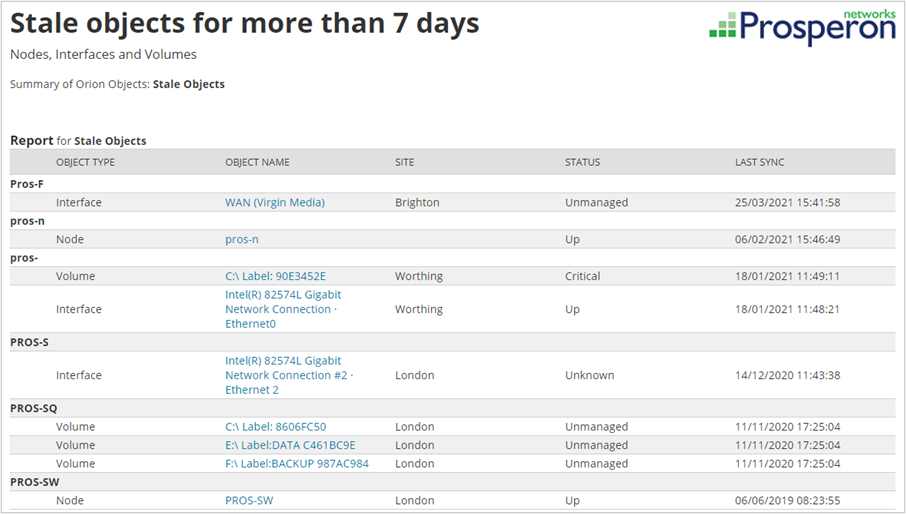
Stale objects for more than 7 days Report
Start by creating a new report and selecting a ‘custom table’ content.
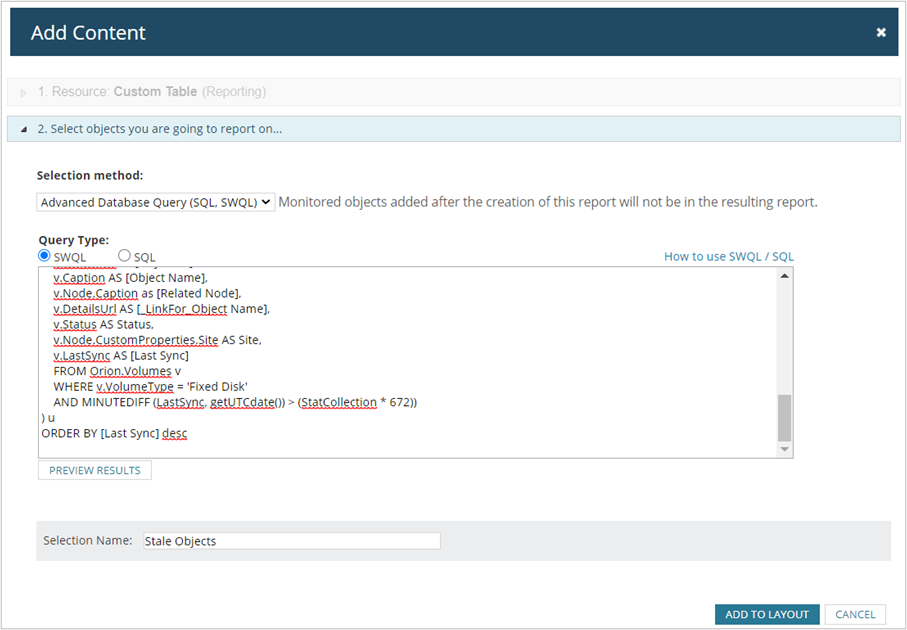
First step is to define the data source, which for this report being a bit more advanced needs some custom query code, so click on for ‘Selection method’, choose ‘Advanced Database Query (SQL, SWQL)’. For ‘Query Type’ select ‘SWQL’. Insert the following SWQL query that will list stale objects (nodes, interfaces and volumes) for more than 7 days.
[code]
SELECT [object type],
[object id],
[object name],
[related node],
[_linkfor_object name],
status,
site,
[last sync]
FROM (SELECT ‘Node’ AS [Object Type],
n.nodeid AS [Object ID],
n.caption AS [Object Name],
n.caption AS [Related Node],
n.detailsurl AS [_LinkFor_Object Name],
n.status AS Status,
n.customproperties.site AS Site,
n.lastsystemuptimepollutc AS [Last Sync]
FROM orion.nodes AS n
WHERE n.objectsubtype <> ‘ICMP’
AND Minutediff (lastsystemuptimepollutc, Getutcdate()) >
( statcollection * 1008 )
AND n.status NOT IN ( 2, 9, 12 )
UNION
(SELECT ‘Interface’ AS [Object Type],
i.interfaceid AS [Object ID],
i.caption AS [Object Name],
i.node.caption AS [Related Node],
i.detailsurl AS [_LinkFor_Object Name],
i.status AS Status,
i.node.customproperties.site AS Site,
i.lastsync AS [Last Sync]
FROM orion.npm.interfaces i
WHERE Minutediff (lastsync, Getutcdate()) > ( statcollection * 1108 ))
UNION
(SELECT ‘Volume’ AS [Object Type],
v.volumeid AS [Object ID],
v.caption AS [Object Name],
v.node.caption AS [Related Node],
v.detailsurl AS [_LinkFor_Object Name],
v.status AS Status,
v.node.customproperties.site AS Site,
v.lastsync AS [Last Sync]
FROM orion.volumes v
WHERE v.volumetype = ‘Fixed Disk’
AND Minutediff (lastsync, Getutcdate()) >
( statcollection * 672 ))) u
ORDER BY [last sync] DESC
[/code]
The period an object is considered stale is controlled in the ‘statcollection’ data field and, that’s calculated based on the defined ‘POLLING STATISTICS INTERVALS’ in ‘Polling Settings’.
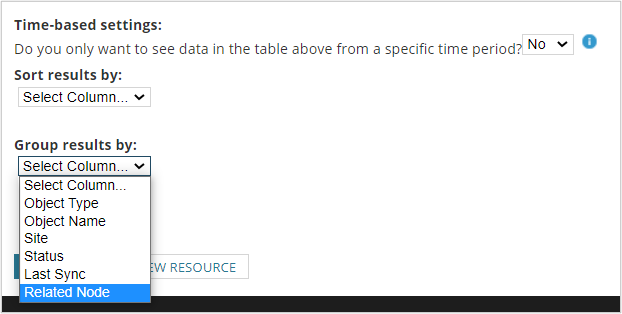
Remember, only the data fields included in the SWQL query are available for display in the data columns of the report, so be prepared to adjust the SWQL query if you wish to add further columns. As before, provide a title and adjust column presentation and, sort and group results as needed. Click ‘Submit’.
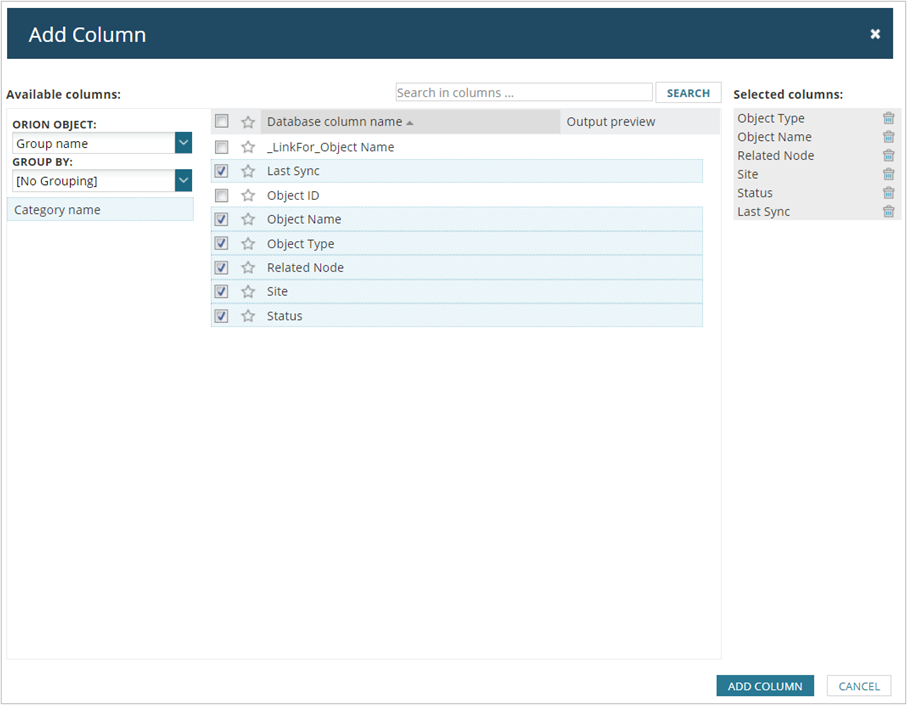
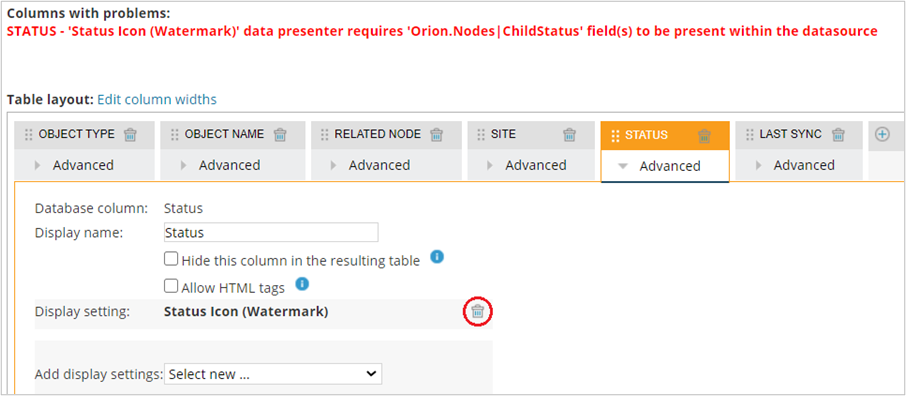
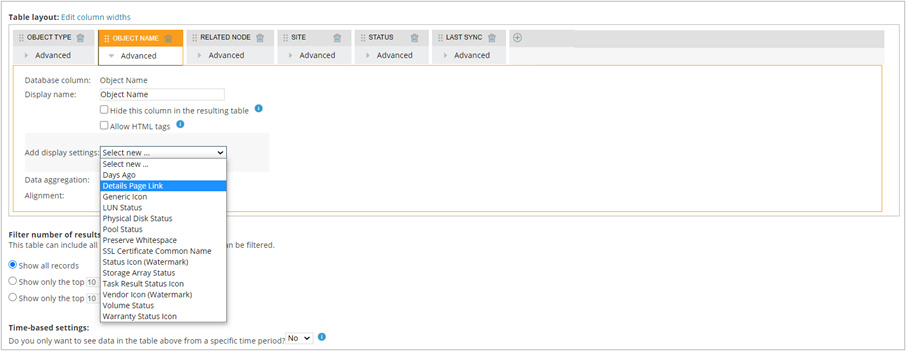
Now, we need to configure the display output, so here you can choose the data columns you wish to display. Click ‘Add Column’ then chose to display:
• Object Type – The type of object displayed
• Object Name – The name of the object displayed
• Related Node – The node on which the object is residing on (this is mainly for interfaces and volumes)
• Site – The geographic location of the node
• Status – Current status of the object
• Last Sync – The last time data was logged for the object
This report will provide you with the visibility needed to flag those nodes, interfaces and volumes, that Orion is no longer able to retrieve data from, that would otherwise be only evident per object in the console.

Abdullah Kamal
Senior SolarWinds Field Engineer
Abdullah is a Senior SolarWinds Field Engineer at Prosperon Networks. As a SolarWinds Engineer for over two years, Abdullah has helped hundreds of customers meet their IT monitoring requirements with SolarWinds.
Upcoming Webinar: The Power of SolarWinds Customisation – Advanced SolarWinds Report
Managing the Challenge: Time, Resource, Knowledge, and Budget
‘’I am the only person that manages our SolarWinds platform, and staying on top of……… is a challenge" Above, is a statement that is common for us to hear, and if you can...
Webinar On-Demand: SolarWinds Best Practices – Out-of-the-Box Vs. Custom Reports
In this webinar, you will discover how to enhance SolarWinds® by going beyond default reports. This webinar examines how to improve the efficiency of your platform by going...
An Introduction To SolarWinds Best Practices – Custom Alerts
Even outside of the IT world, the first thing that many people think of when you hear the term 'monitoring' is alerts. Whether it be a flashing light, a siren, or in the...


