How to Automate Link to PerfStack in a SolarWinds Alert
PerfStack (Performance Analysis) is a feature introduced into the SolarWinds® Orion platform 2017.1 and despite how fantastic this feature is, we’ve noticed as we work with our customers, the few that are aware of it or not taking full advantage of it.
Just a quick introduction; PerfStack is and easy to build dashboard that allows you to drag and drop current and historical data metrics of your monitored infrastructure, across all Orion modules. The way the data is presented, with metrics stacked on top of each other, provides an interface that makes is easier and more efficient to investigate incidents, identify root causes of intermittent issues and present in views.
In this post I wanted to show you one of the ways to utilise PerfStack is to build a dynamic link, based on a URL built-on a specific set of metrics covering distinct monitored elements and a historical timeseries. This URL can then be used within Alert notifications, within other areas of the web interface to allow users to access this rich interface quickly and easily.
As an example, an alert for packet loss on an interface is a well known issue that might be experienced on a network from time to time. The root cause of packet loss can vary from a lose cable connection to a duplex mismatch but, in all likelihood, it will be some performance or configuration issue. Let us utilise PerfStack within an alert notification so which ever interface triggers this alert the Perfstack URL link can be embedded providing this powerful analysis method.
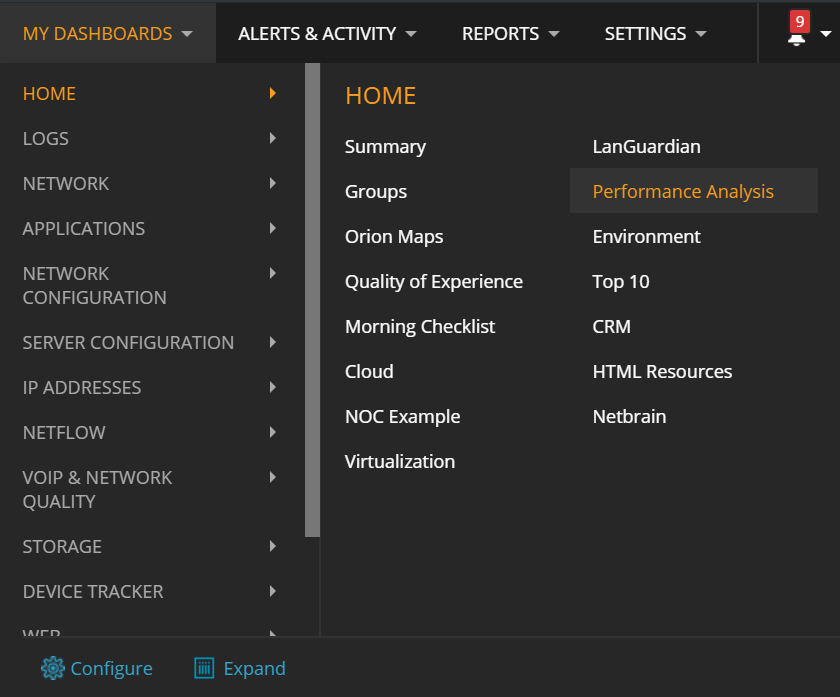
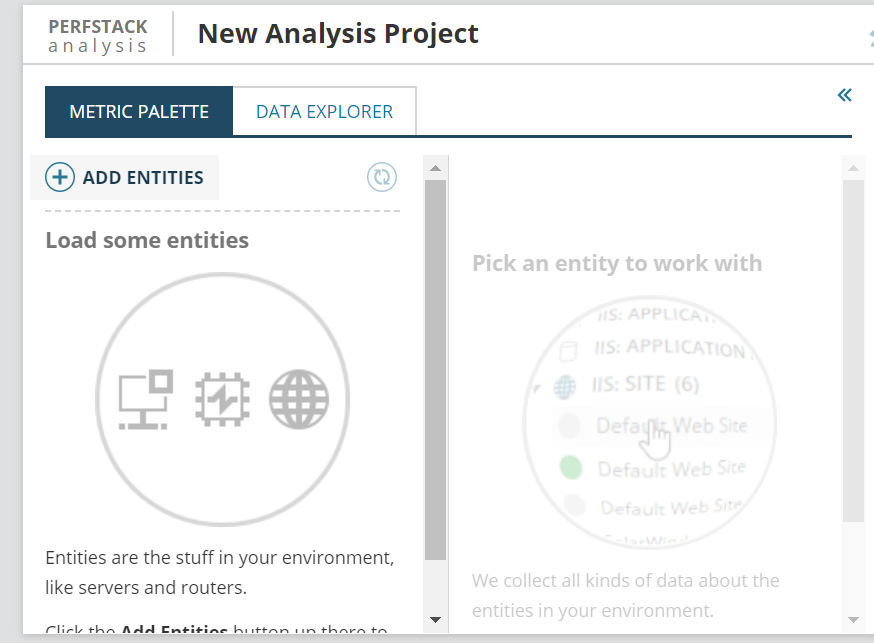
To build a PerfStack dashboard got Performance Analysis under Home = My Dashboards.
Note: You can navigate directly to http(s)://OrionServer/ui/perfstack/
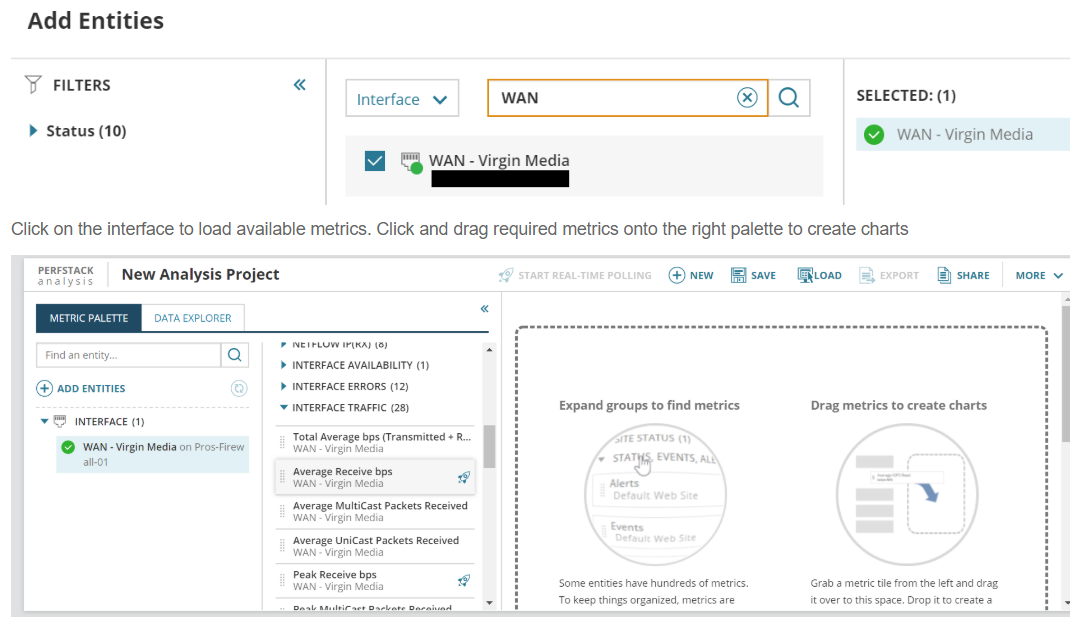
We’ll be listing the metrics I’m interested in that will provide insight to packet loss.
- Availability
- Received Discards
- Transmit Discards
- Received Errors
- Transmit Errors
- Average Receive bps
- Total Packets Received
- Total Packets Transmitted
- Received Percent Utilization
- Transmit Percent Utilization
From the parent node, I’m also adding:
- Average CPU Load
- Average Percent Memory Used
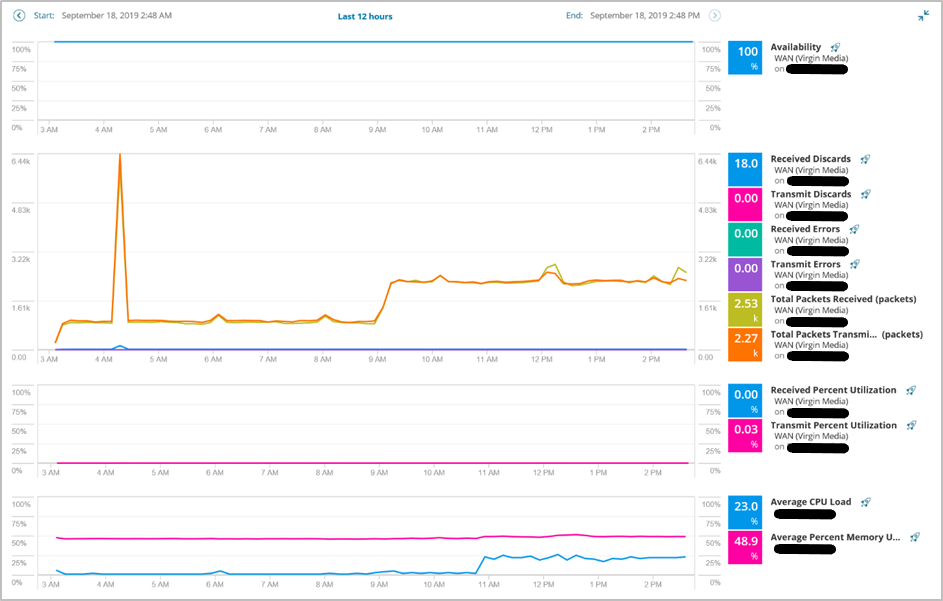
It will look something like this.
- The time period PerfStack is covering
- The metrics that are displayed
- The object on which the metrics are reporting on
- Metrics are separated or grouped in charts using the semicolon. A comma, within semicolons, groups those metrics in a single chart.
[code]http(s)://OrionServer/ui/perfstack/?presetTime=last12Hours&charts=0_Orion.NPM.Interfaces_98-
Orion.NPM.InterfaceAvailability.Availability;0_Orion.NPM.Interfaces_98-
Orion.NPM.InterfaceErrors.InDiscards,0_Orion.NPM.Interfaces_98-
Orion.NPM.InterfaceErrors.OutDiscards,0_Orion.NPM.Interfaces_98-
Orion.NPM.InterfaceErrors.InErrors,0_Orion.NPM.Interfaces_98-
Orion.NPM.InterfaceErrors.OutErrors,0_Orion.NPM.Interfaces_98-
Orion.NPM.InterfaceTraffic.InTotalPkts,0_Orion.NPM.Interfaces_98-
Orion.NPM.InterfaceTraffic.OutTotalPkts;0_Orion.NPM.Interfaces_98-
Orion.NPM.InterfaceTraffic.InPercentUtil,0_Orion.NPM.Interfaces_98-
Orion.NPM.InterfaceTraffic.OutPercentUtil;0_Orion.Nodes_23-
Orion.CPULoad.AvgLoad,0_Orion.Nodes_23-Orion.CPULoad.AvgPercentMemoryUsed;[/code]
By understanding the URL structure, we can include this URL as a link in email alert. If you have ever looked at the URL format when drilling into a detail page, the numbers within the blue wording above will make sense. Just to be clear, when you navigate in Orion to say the Node Detail page, you will see the URL format includes the internal database ID of that node. This is the same value represented above, which in our example is NodeID 23;
[code]https://pros-orion-05/Server/0/Orion/NetPerfMon/NodeDetails.aspx?NetObject=N:25[/code]
In this format, this link is static and points to a specific set of elements. We need this link to be dynamic by automatically inserting relevant elements as alerts are triggered. In this scenario, this can be done by replacing Interface ID, and Node ID, with the appropriate variables.
[code]http(s)://OrionServer
/ui/perfstack/?presetTime=last12Hours&charts=0_Orion.NPM.Interfaces_${N=SwisEntity;M=InterfaceID}-
Orion.NPM.InterfaceAvailability.Availability;0_Orion.NPM.Interfaces_${N=SwisEntity;M=InterfaceID}-
Orion.NPM.InterfaceErrors.InDiscards,0_Orion.NPM.Interfaces_${N=SwisEntity;M=InterfaceID}-
Orion.NPM.InterfaceErrors.OutDiscards,0_Orion.NPM.Interfaces_${N=SwisEntity;M=InterfaceID}-
Orion.NPM.InterfaceErrors.InErrors,0_Orion.NPM.Interfaces_${N=SwisEntity;M=InterfaceID}-
Orion.NPM.InterfaceErrors.OutErrors,0_Orion.NPM.Interfaces_${N=SwisEntity;M=InterfaceID}-
Orion.NPM.InterfaceTraffic.InTotalPkts,0_Orion.NPM.Interfaces_${N=SwisEntity;M=InterfaceID}-
Orion.NPM.InterfaceTraffic.OutTotalPkts;0_Orion.NPM.Interfaces_${N=SwisEntity;M=InterfaceID}-
Orion.NPM.InterfaceTraffic.InPercentUtil,0_Orion.NPM.Interfaces_${N=SwisEntity;M=InterfaceID}-
Orion.NPM.InterfaceTraffic.OutPercentUtil;0_Orion.Nodes_${N=SwisEntity;M=NodeID}-
Orion.CPULoad.AvgLoad,0_Orion.Nodes_${N=SwisEntity;M=NodeID}-
Orion.CPULoad.AvgPercentMemoryUsed;[/code]
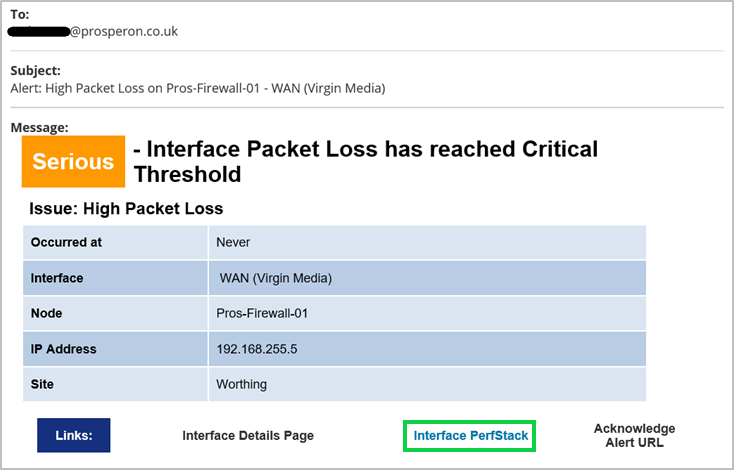
This is an example of an email alert with PerfStack URL embedded into the HTML code of the email.
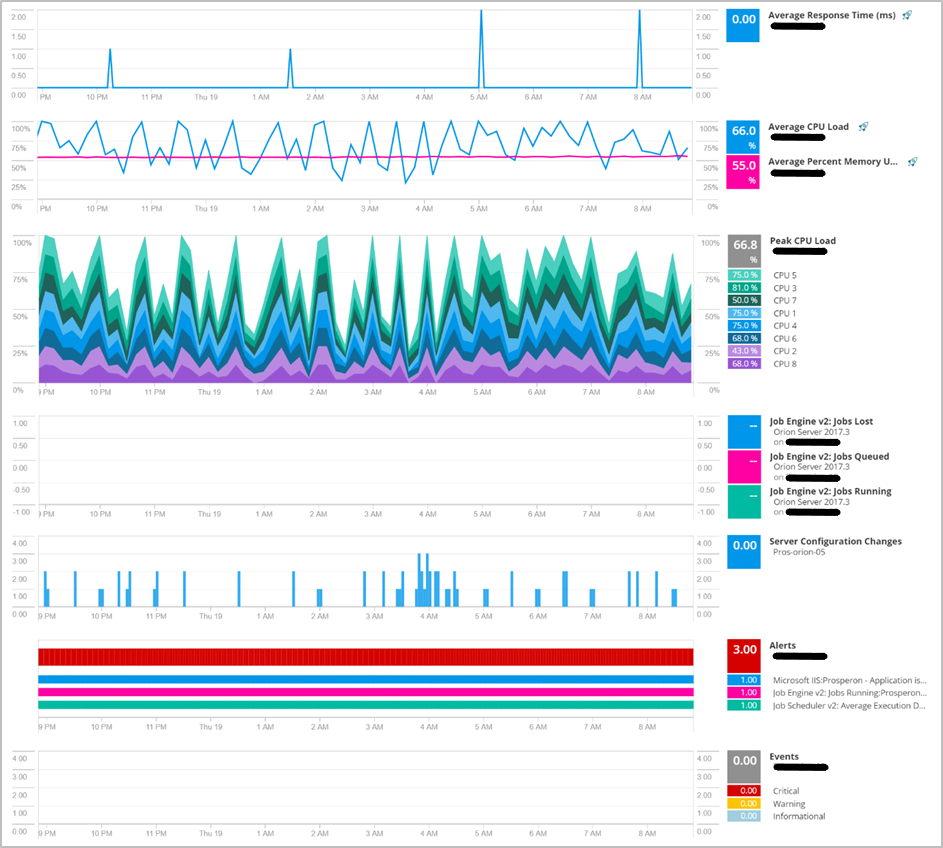
This works across all areas of Orion, so we can take this approach for any other common issues which may occur. For example, for a High CPU Utilisation alert on a server hosting a Job Queue Service. The incorporated PerfStack link can include;
- Average Response Time
- Average CPU Load
- Average Percent Memory Used
- Peak CPU Load (for every core)
- Job Queue Stats (for an application)
- Server Configuration Changes (Statistical)
- Alerts (Statistical)
- Events (Statistical)
[code]http(s)://OrionServer/ui/perfstack/?presetTime=last24Hours&charts=0_Orion.Nodes_149-
Orion.ResponseTime.AvgResponseTime;0_Orion.Nodes_149-Orion.CPULoad.AvgLoad,0_Orion.Nodes_149-
Orion.CPULoad.AvgPercentMemoryUsed;0_Orion.Nodes_149-
Orion.CPUMultiLoad.MaxLoad;0_Orion.APM.GenericApplication_246-
Orion.APM.PortEvidenceChart.37.27587,0_Orion.APM.GenericApplication_246-
Orion.APM.PortEvidenceChart.37.27586,0_Orion.APM.GenericApplication_246-
Orion.APM.PortEvidenceChart.37.27588;0_Orion.Nodes_149-
Orion.PerfStack.ScmChanges;0_Orion.Nodes_149-Orion.PerfStack.Alerts;0_Orion.Nodes_149-
Orion.PerfStack.Events;[/code]
These PerfStack Dashboards can be shared with other parties, if they have access on the Orion Platform, and the necessary permissions on the elements being reported on.
What metrics are available to you is dependent on the installed SolarWinds Orion modules. For example, SAM is required for metrics like processes/services, online resources in a cluster, requests/sec (e.g. Sharepoint), etc.. and, SRM for LUN metrics like IOPs, Throughput, Cache Hit Ratio, etc…
Don’t forget, if you are creating a Perfstack project to analyse an issue, just simply copy and paste that link to a colleague if you wish to share your data and findings.
This is just the beginning. As these examples demonstrate, with PerfStack, you can incorporate ‘end-to-end’ metrics, from across your monitored infrastructure, that represent a critical service in a single link, which is embedded into an alert for your support engineers to have instantaneous insight onto an incident.
Training Course: SolarWinds Training Courses

Abdullah Kamal
Senior SolarWinds Field Engineer
Abdullah is a Senior SolarWinds Field Engineer at Prosperon Networks. As a SolarWinds Engineer for over two years, Abdullah has helped hundreds of customers meet their IT monitoring requirements with SolarWinds.
Training Course: SolarWinds Training Courses
Related Insights From The Prosperon Blog
Don’t get lost! Mapping your Network with SolarWinds
Heard of SolarWinds Intelligent Maps and never known where to start with them? You’re in luck! Join us as we chart a course……sorry I couldn’t resist! Let’s navigate through...
The Critical Role Of The Trusted Advisor In NetOps
Before there was “Network Operations” there were networks. Networks grew out of a need for connecting one box to another, sharing printers, and for more advanced users,...
Webinar On-Demand: Beyond Monitoring – Introducing SolarWinds Observability Platform
In this webinar, you will discover how SolarWinds® is evolving to deliver complete infrastructure visibility. This webinar examines how to extend visibility across your IT...

