SolarWinds Patch Manager & Orion Platform Integration – Part 1
In the first of a two-part article, I will show you how to integrate Patch Manager with the SolarWinds Orion platform and describe the out-of-the-box views on Orion. Lastly, we will go further and look at how to create views, reports, and alerts on Orion Platform based-on Patch Manager data. The benefit of this is that patching state and actions can have a direct impact on the health and status of a server and the applications upon it.
Patch Manager and Orion Platform Integration Configuration
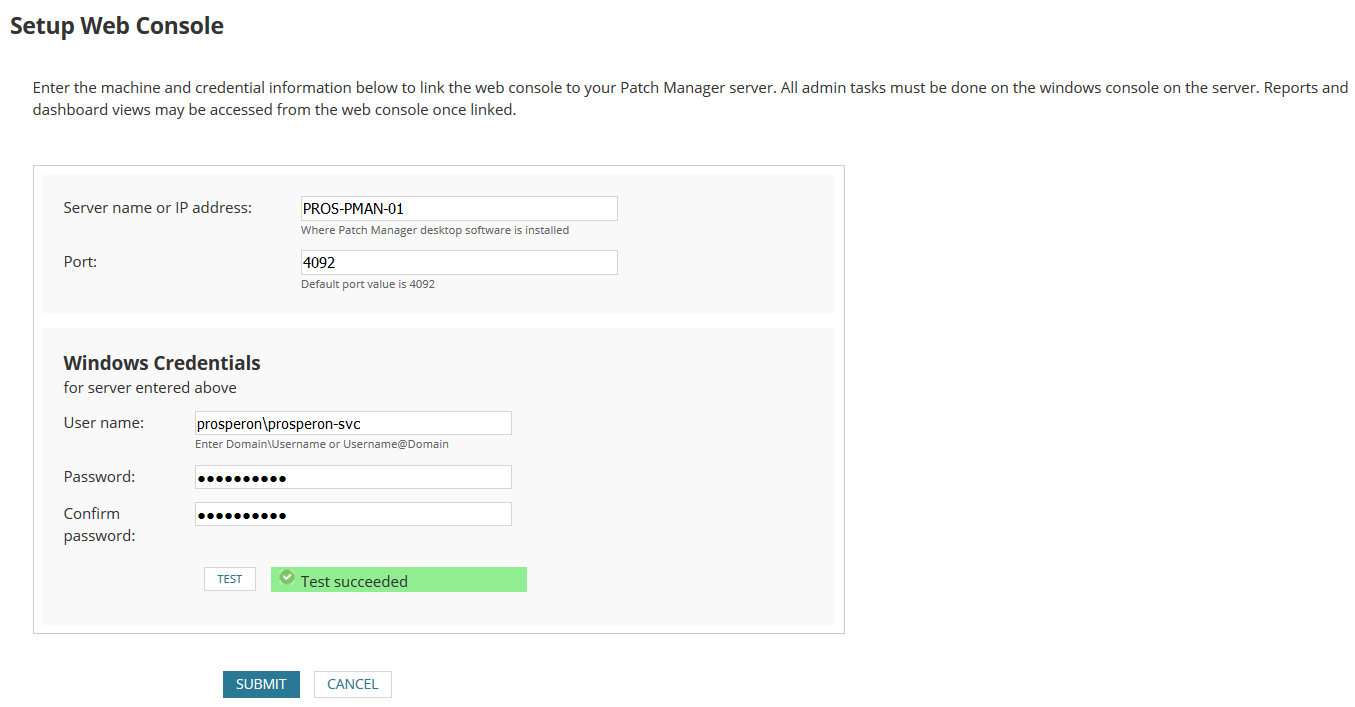
To integrate Patch Manager with Orion the web console integration should be installed on the Orion server as described and then Patch Manager location details should be added to the Orion Configuration Screen:
After successfully integrating Patch Manager with Orion platform, it is possible to see data from Patch Manager with three different perspectives:
- WSUS perspective shows data based on WSUS servers
- Node perspective shows data based on the device
- Patch perspective shows data based on the update
“Patch Summary” view will show the overview data across each of these entities and provides a great insight into the key information on patching levels. ‘Some’ might say this is better than the default view in Patch Manager’s own GUI.
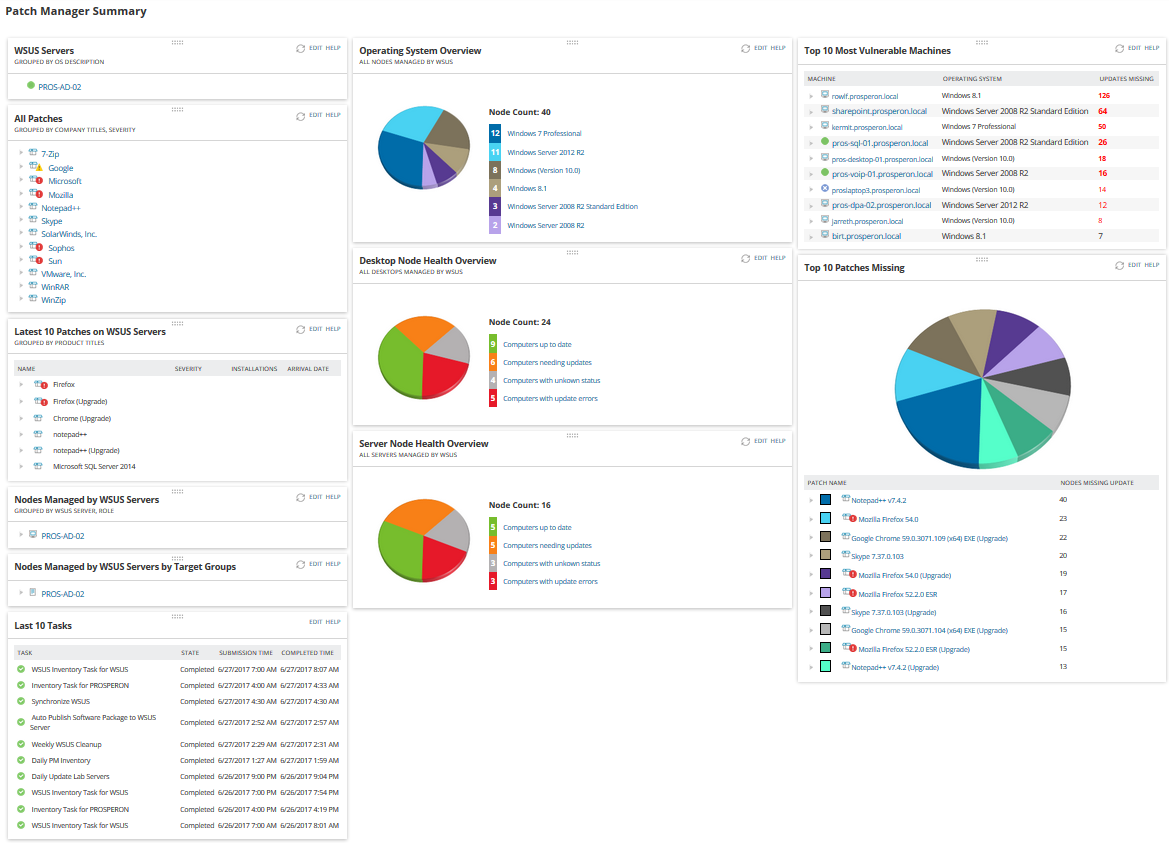
On this summary view, it is possible to see a list of WSUS servers, list of managed patches, list of nodes, list of latest tasks and list of top missing patches. Pie chart resources allow you to see high-level information about device status for servers and workstations.
As is the way in the Orion GUI entity links allow to drill down to see more details:
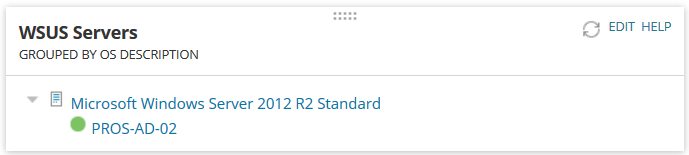
- “WSUS Servers” resource provides a list of WSUS servers that Patch Manager is integrated.
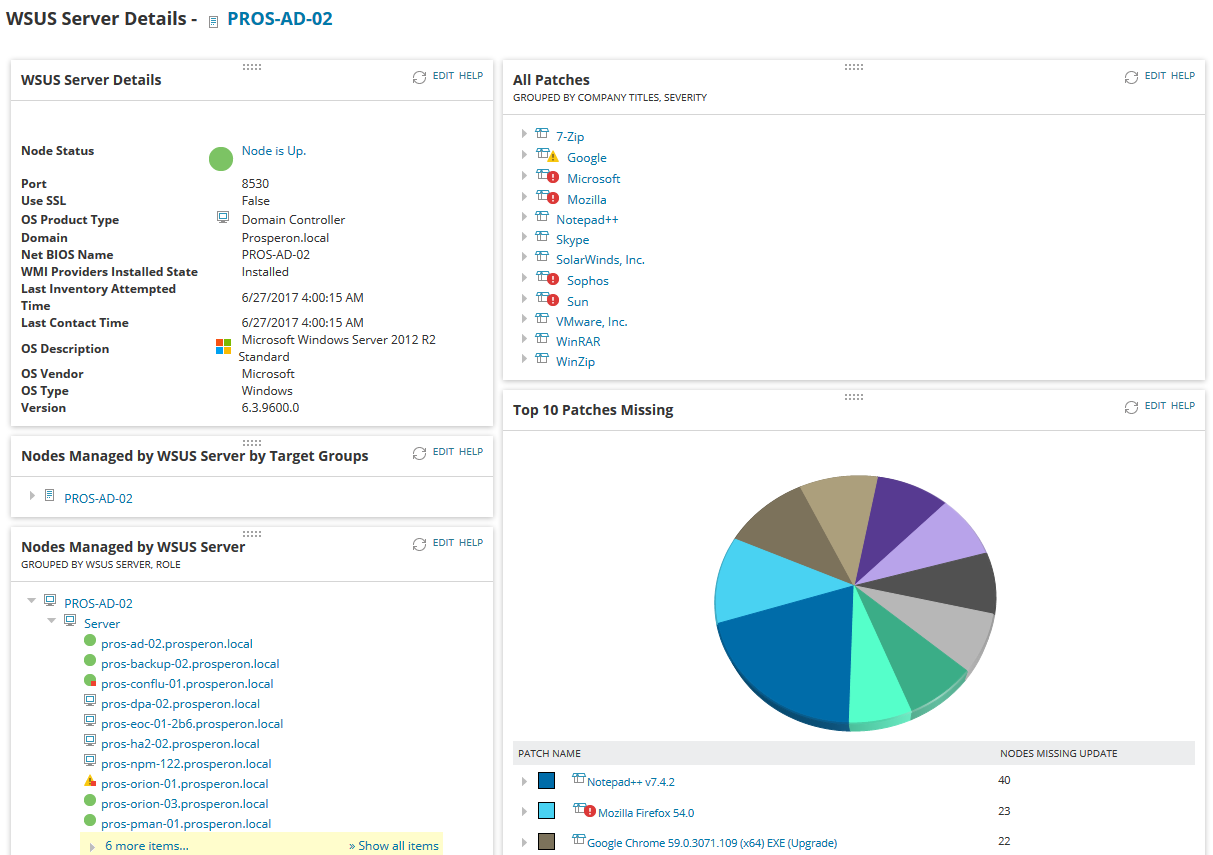
- “Nodes Managed by WSUS Servers” resource provides a list of devices managed by WSUS servers and these devices are grouped as Server or Workstation according to their OS types:
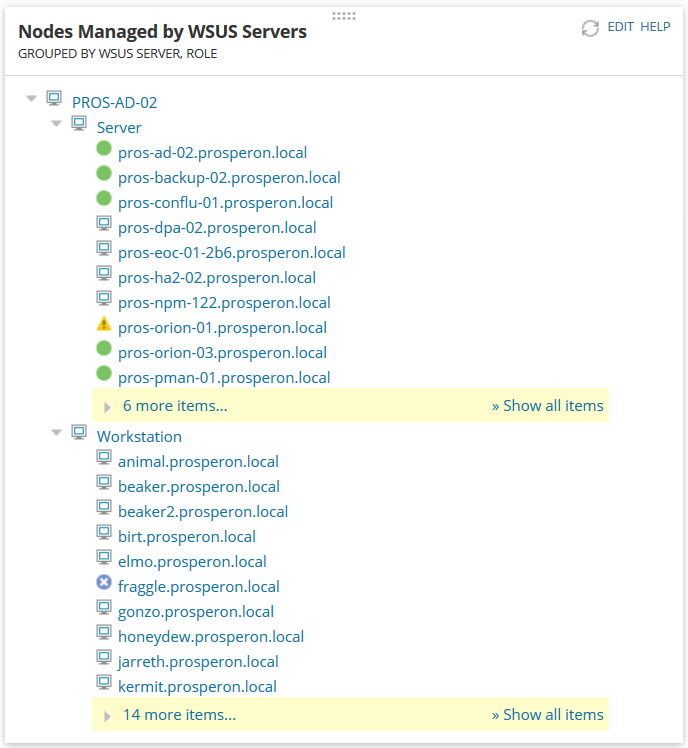
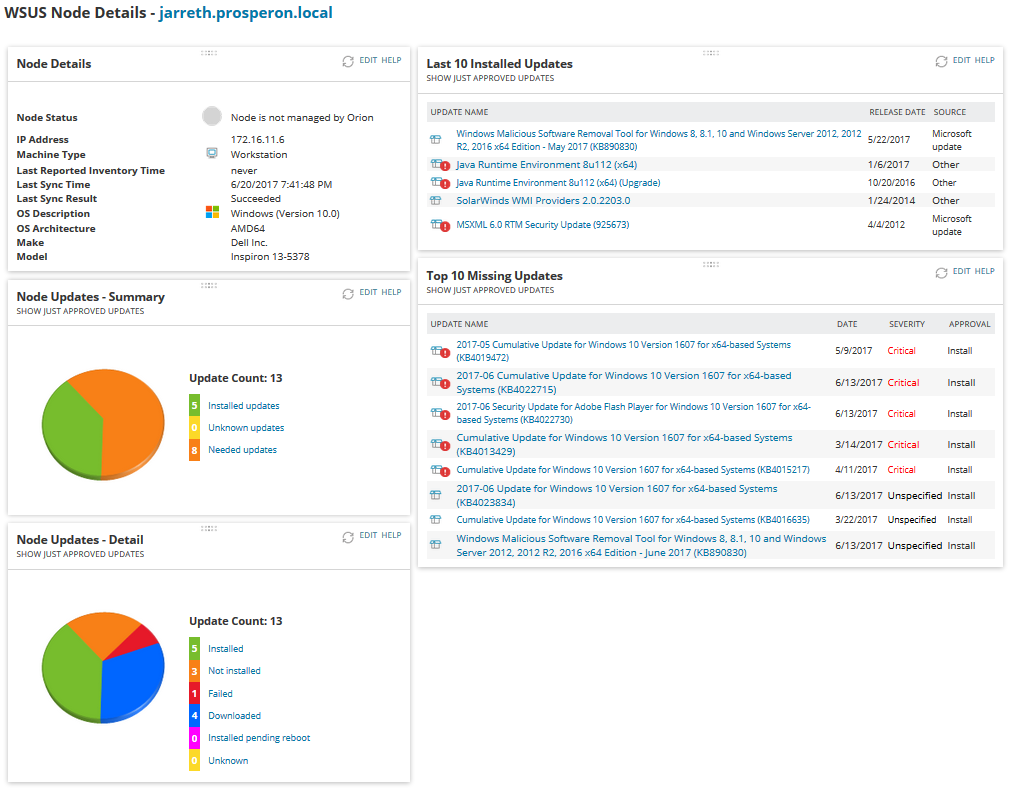
Icon on the left side of the device name shows the status of this device if it is currently monitored by SolarWinds Orion. The icon means that the device is not currently monitored in Orion which is a good way to identify if you have servers that should be monitored by Orion, which of course they should. Clicking on one of the node names shows all the patch details for the selected node.
- “All Patches” resource shows the list of patches grouped by solution vendor and the recorded severity:
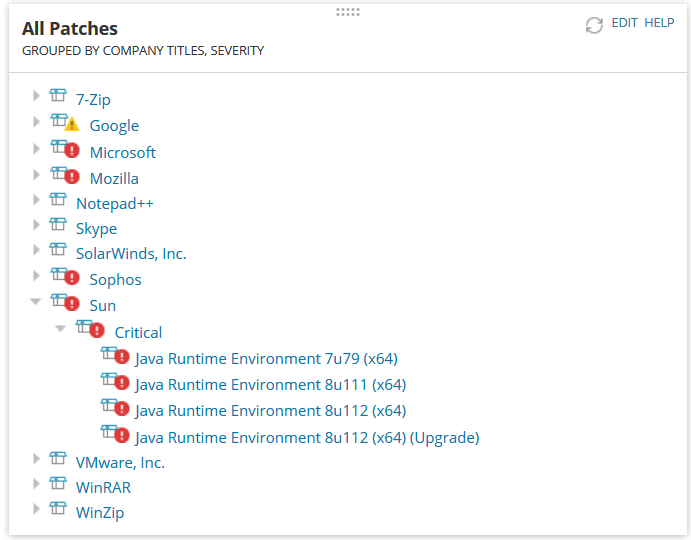
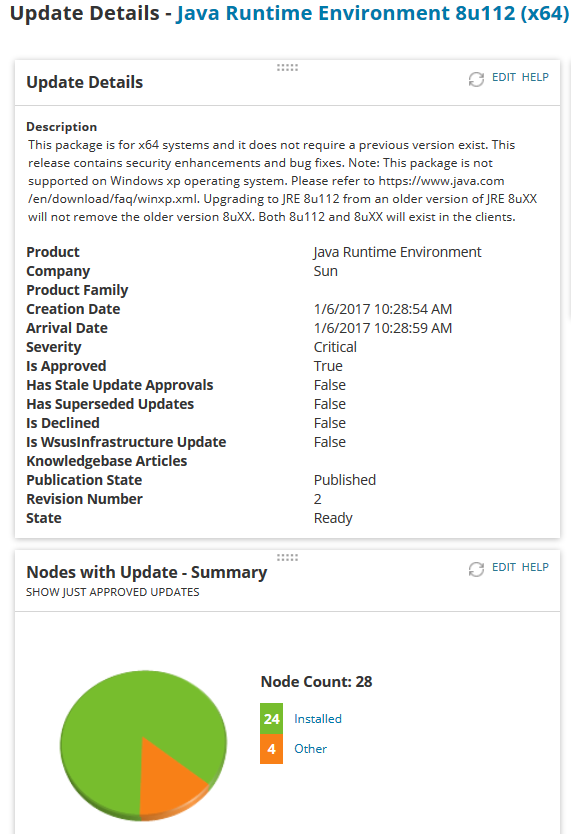
A great feature is the ability to identify the details of the patches by clicking on the name:
Advanced Features
Until now, we see the default visual features of the Patch Manager and Orion integration provided by SolarWinds out-of-the-box. In addition to these, we can go forward with the help of the SWQL queries. Let’s focus on these advanced features.
As we saw before, SolarWinds provides “WSUS Node Details” view to see Patch Manager details for each node. If a node is already managed by SolarWinds then it is meaningful to add Patch Manager resources to standard Orion node detail views.
In any node detail view, we can add Patch Manager resources by clicking on the “Customize Page” button on the right top corner of the node details page:
Then we should click on “Add Resources” button on any column, group resources by “Classic Category” and select “Patch Manager Nodes”. Now we can select any of the resources on the new screen related with Patch Manager.
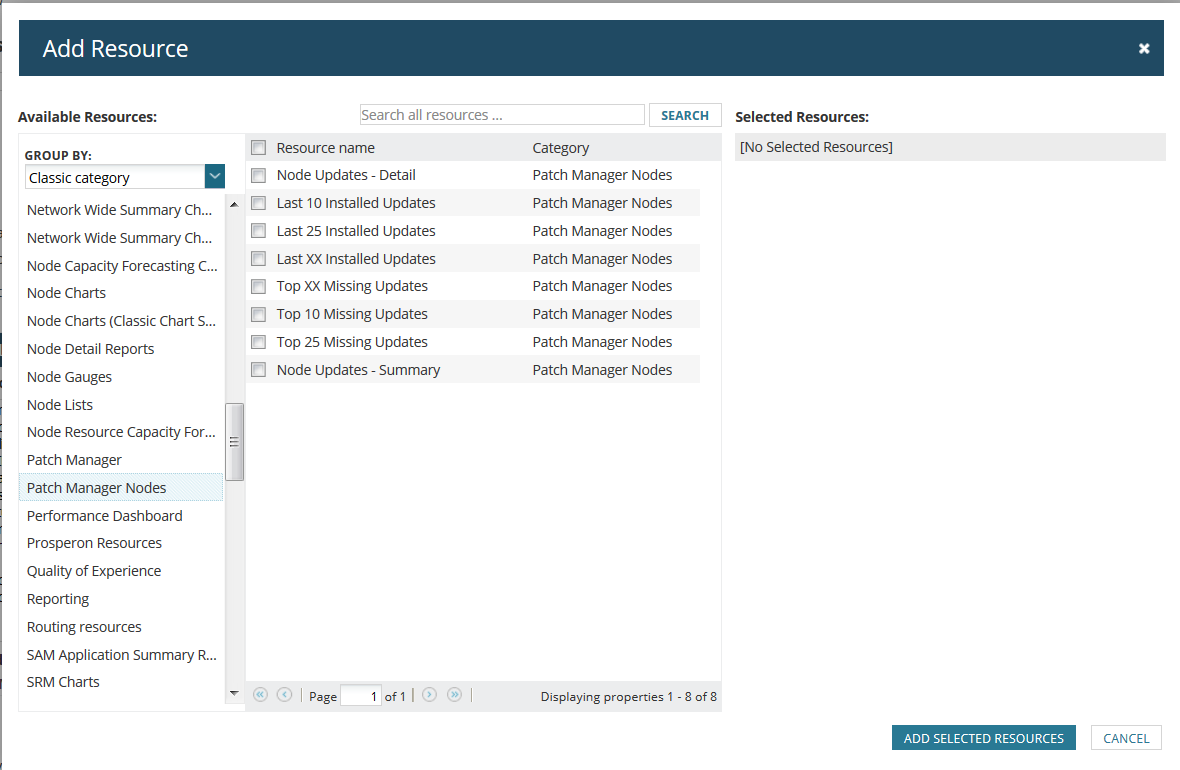
It is beneficial to see the latest patches, missing patches and a general patch overview for the node so decided to add 3 resources:
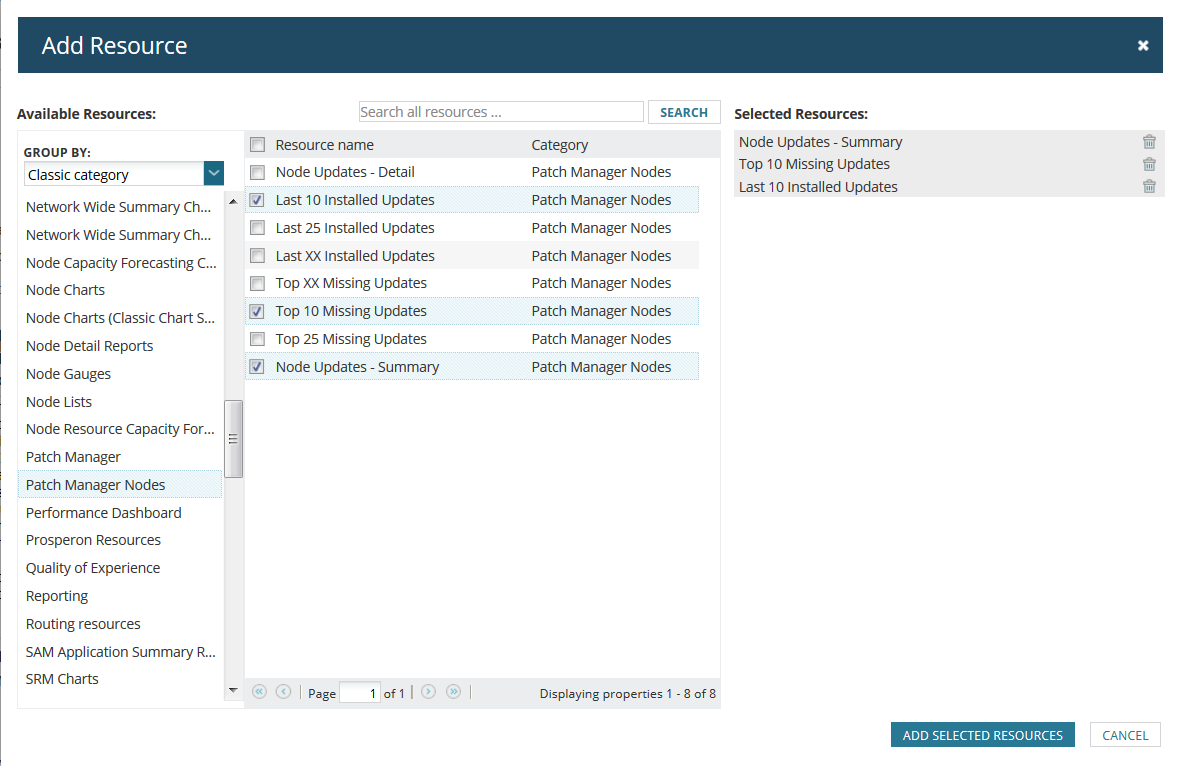
Now we are able to see patch information and monitoring information at the same page on Node Detail view as below:

Product Trial: SolarWinds Patch Manager
SolarWinds Orion Reporting
Patch Manager provides Reporting feature but it is also a good idea to use Orion Reporting platform to create reports on patches and devices.
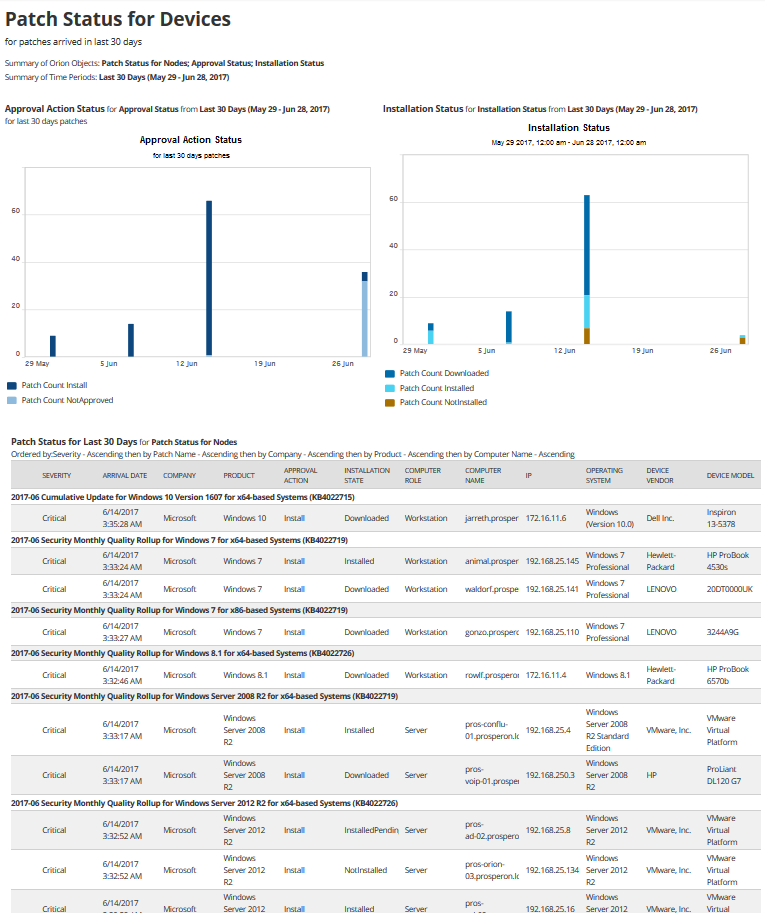
The following example shows all the patches that have arrived in the last 30 days with the approval and installation status for each node. Patch and node details are given in the list and charts show the number of patches for the same time period with approval status and installation status respectively.
You can download this example report here: Report – SolarWinds Patch Manager Status for Devices
Currently, it is not possible to create alerts on Patch Manager and there is no out-of-the-box solution on Orion platform for alerting in relation to patch management. So let’s define an alert for the nodes monitored by Orion platform according to the information from Patch Manager.
This is an example alert definition to check devices monitored in Orion and has approved but non-installed updates.
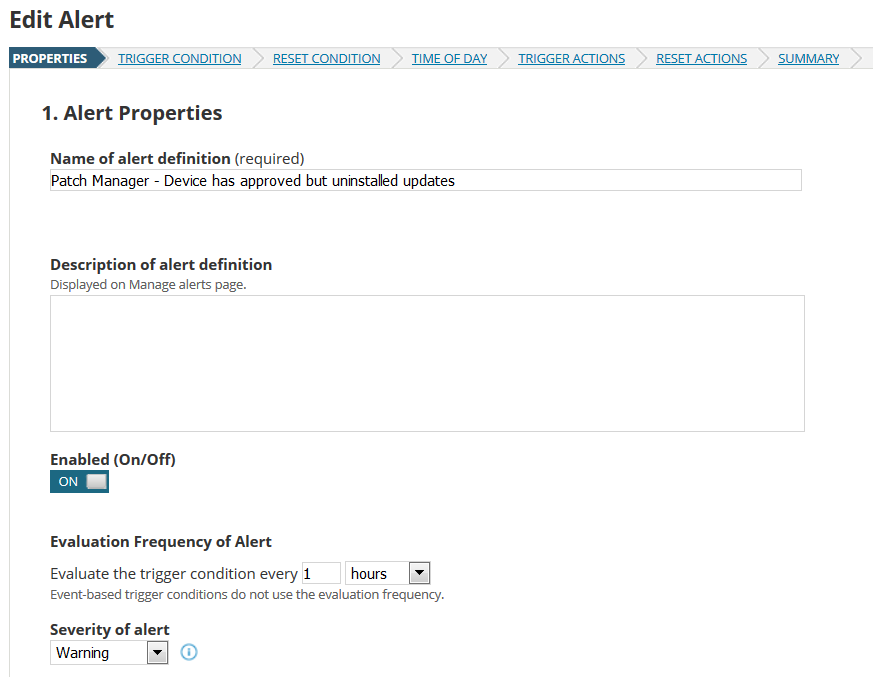
Create a new blank alert in Orion and define a title and description. As this is a non-time urgent alert, set the poll interval to 60 minutes. Severity can be set as Warning, Serious or Critical according to your perception of the problem.
At the trigger condition step, choose “Custom SWQL Alert (Advanced)” with the query set to alert on Node level as below:
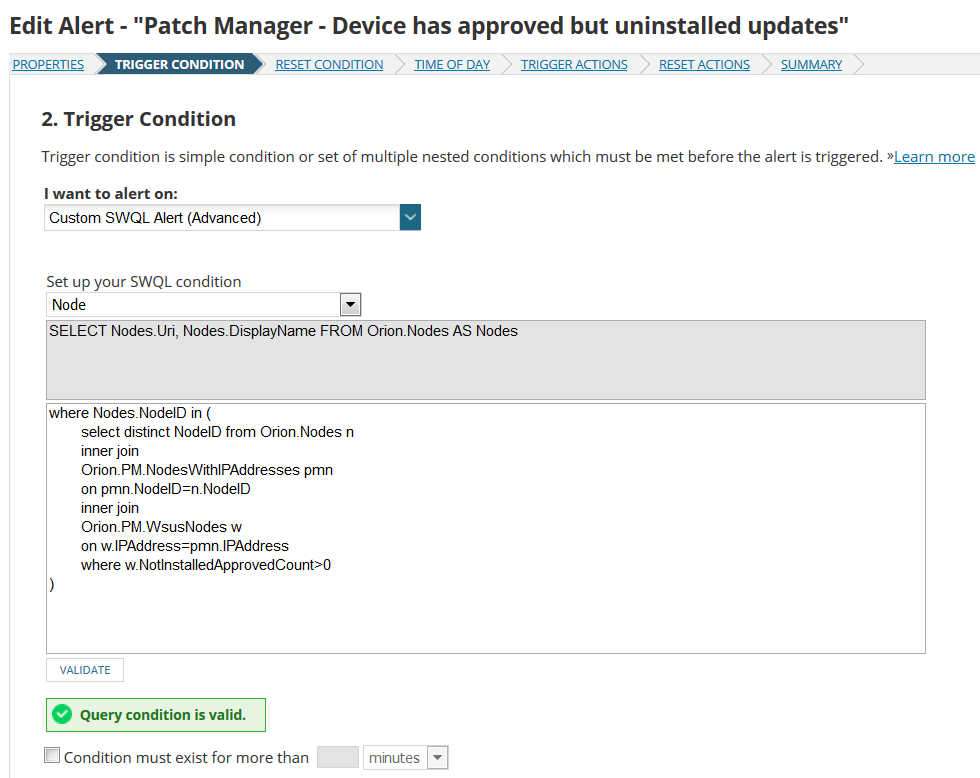
[code]where Nodes.NodeID in (
select distinct NodeID from Orion.Nodes n
inner join
Orion.PM.NodesWithIPAddresses pmn
on pmn.NodeID=n.NodeID
inner join
Orion.PM.WsusNodes w
on w.IPAddress=pmn.IPAddress
where w.NotInstalledApprovedCount>0
)[/code]
“Reset Condition” and “Time of Day” steps can be at the default state. For the trigger action step, an email action can be defined as below:

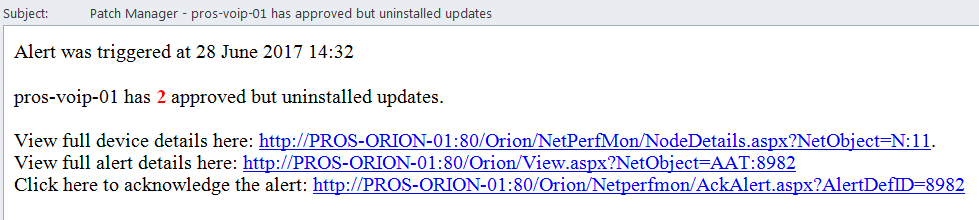
Patch Manager – ${N=SwisEntity;M=Caption} has approved but uninstalled updates
Message:
Alert was triggered at ${N=Alerting;M=AlertTriggerTime;F=DateTime}
${N=SwisEntity;M=Caption} has <font color=red><b> ${N=SWQL;M=select distinct w.NotInstalledApprovedCount from Orion.Nodes n inner join Orion.PM.NodesWithIPAddresses pmn on pmn.NodeID=n.NodeID inner join Orion.PM.WsusNodes w on w.IPAddress=pmn.IPAddress where w.NotInstalledApprovedCount>0 and NodeID=${N=SwisEntity;M=NodeID}} </b> </font> approved but uninstalled updates.
View full device details here: ${N=SwisEntity;M=DetailsUrl}.
View full alert details here: ${N=Alerting;M=AlertDetailsUrl}
Click here to acknowledge the alert: ${N=Alerting;M=AcknowledgeUrl}[/code]
After adding an email action, we can go to the summary step with the “Next” button and submit the alert.
When the email is triggered, resulting email will be seen as below:
As SWQL gives us the independence to combine any kind of data on Orion, you can create various reports or alerts according to your requirements.
Be sure to come back next week for the concluding part of this article.

Ecmel Ozdemir
Snr. SolarWinds Engineer
Product Trial: SolarWinds Patch Manager
Related Insights From The Prosperon Blog
Enhance Database Monitoring with SolarWinds SQL Sentry
Recent Improvements to SQL Sentry In the fast-paced world of database management, staying on top of performance monitoring and optimisation is crucial. Database...
Database in Distress – important Database metrics on one screen with SolarWinds
Webinar: Database in Distress How to understand important Database metrics on one screen with SolarWindsIn this Webinar on Monday 5th June, you will discover how SolarWinds®...
Webinar On-Demand: SolarWinds Database Monitoring – Actual Bona Fide Database Administrators
In this webinar, you will discover how SolarWinds® can help Database Administrators to meet their advancing Database monitoring and configuration challenges. This webinar...