Enhance Database Monitoring with SolarWinds SQL Sentry
Recent Improvements to SQL Sentry
In the fast-paced world of database management, staying on top of performance monitoring and optimisation is crucial. Database administrators and developers are continually seeking ways to improve efficiency, streamline operations, and ensure the optimal functioning of their SQL Server environments. DBA’s are, quite rightly, very precious about their platforms, and inefficient use of these leads to poor service performance and higher financial cost impacts.
One indispensable tool in this pursuit is SQL Sentry, a comprehensive monitoring solution from SolarWinds® that has recently undergone significant improvements to further empower users. In this blog post, we’ll delve into the recent enhancements in SQL Sentry 2023.3 that will greatly improve the way you manage and optimise SQL Server databases.
Viewing Overall Health
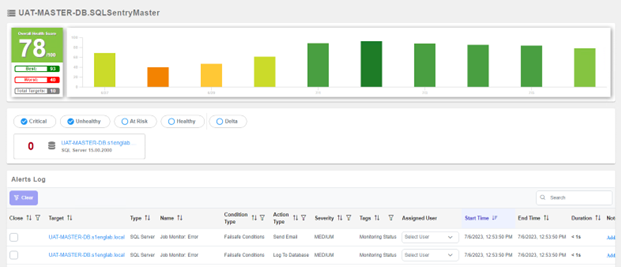
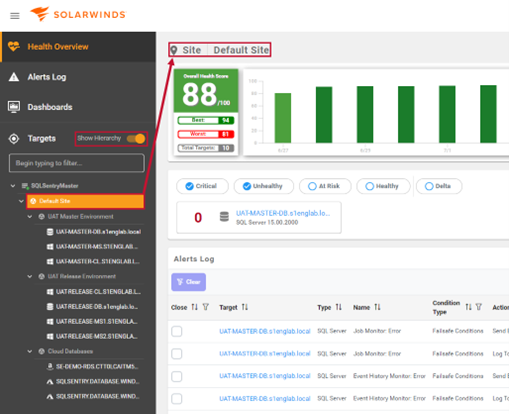
One of the notable enhancements in recent versions of SQL Sentry is the introduction of a new view that provides a holistic snapshot of the overall health of your monitored targets. This feature is a game-changer for database administrators, offering a consolidated dashboard that displays critical information about the state of your SQL Server instances and databases.
In the Health Overview dashboard we have an easy-to-digest status box displaying the current health of your environment over the last 24 hours. Of that time period, three figures are given: the highest recorded health score; the lowest recorded health score; and the total number of monitored targets within the selection. Next to that overview, a bar graph gives us the overall health score of your environment across the last 30 days, allowing you to quickly compare your current health score with more historical data.
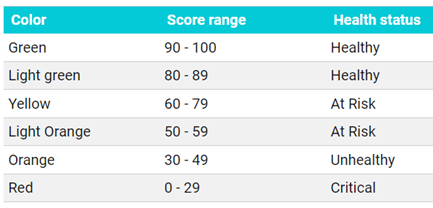
We’re all very happy to see the burden of judging health alleviated with this feature. No more hesitant responses to stakeholders with caveats and overly technical language – we can now easily present the overview and say with confidence whether an object is healthy, at risk, unhealthy, or critical.
1.2 Top SQL Wait Statistics Charts
Another significant improvement in SQL Sentry is the ability to gain a unified perspective on collected SQL statements. SQL queries and statements lie at the heart of database performance, and having a cohesive analysis tool is invaluable. With the top wait charts enhancement, SQL Sentry offers a more efficient way to analyse SQL statements across different databases and SQL Server instances that are causing the most waits, consuming the most resources, taking the most time, and putting the most load on your SQL Server.
Starting with Version 2023.3, wait information can be divided up and presented by the following categories:
• Queries
• Waits by Application (the source of the query being processed)
• Waits by Database (which database on the server is being used)
• Waits by Host (the source machine of the query being processed)
• Waits by Login (which user login is processing the query)
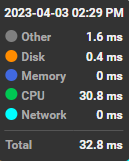
We find the waits by login extremely valuable. While identifying waits by other categories gives great insight, logins will often immediately give us the answer as to where issues lie. How often have we administrators been able to pinpoint a problem the moment a user or service account is named? As you can see below, hovering over the chart tells us immediately the logins behind the bar chart segments.
SQLSentry 2023.4
Of course, spotting the user is only part one. What exactly is that login querying? What are the queries, and how is that wait distributed? Here is where the queries filter really gets to shine.
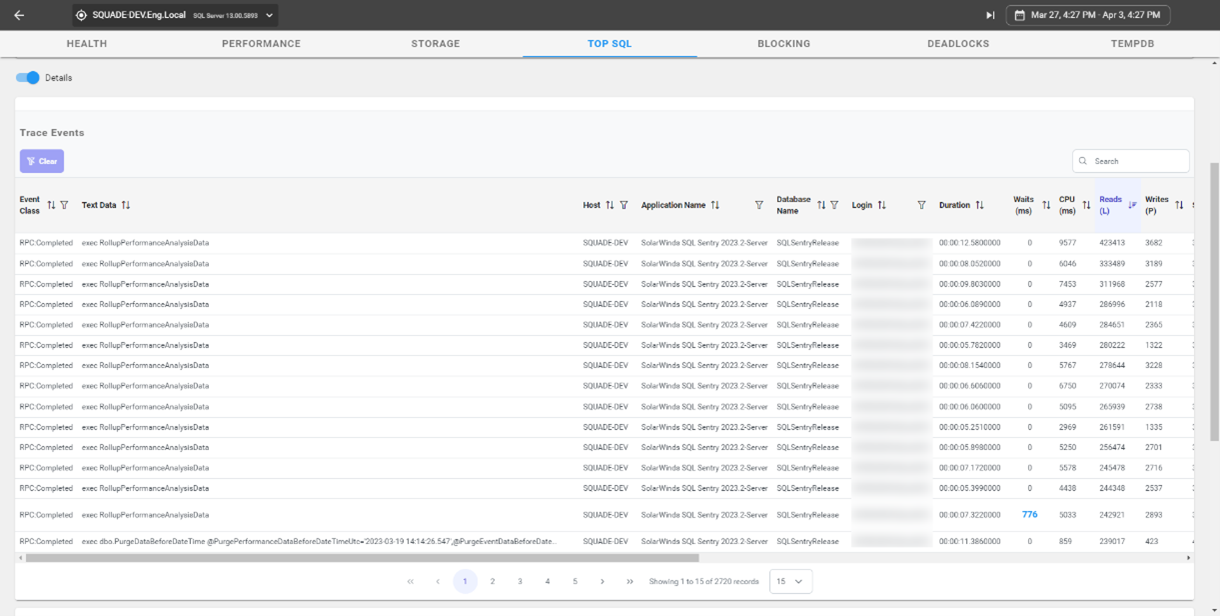
At the bottom of Top SQL page, we have the Totals table. This displays the text data and associated information such as database, duration, count, and CPU for the collected SQL statements (including procedure stats, query stats, and completed queries).
1.3 Conclusion
SQL Sentry continues to play a pivotal role in ensuring optimal performance and reliability. The recent improvements in 2023.3 bring greater convenience and efficiency to database administrators and developers. It’s gratifying to see SQL Sentry continue to evolve. We hope that you leverage SQL Sentry to stay at the forefront of performance optimisation and keep your SQL Server environments running smoothly and efficiently!
SQLSentry 2023.4

Rob Kavanagh
Senior SolarWinds Engineer, Prosperon
Robert Kavanagh is a Senior Monitoring Engineer at Prosperon. As a Senior SolarWinds Engineer for over eight years, Robert has helped hundreds of customers of all industries and scale meet their IT monitoring needs with SolarWinds Solutions, from deployment, customisation, scripting and more.
SQLSentry 2023.4
Related Insights From The Prosperon Blog
Database in Distress – important Database metrics on one screen with SolarWinds
Webinar: Database in Distress How to understand important Database metrics on one screen with SolarWindsIn this Webinar on Monday 5th June, you will discover how SolarWinds®...
Webinar On-Demand: SolarWinds Database Monitoring – Actual Bona Fide Database Administrators
In this webinar, you will discover how SolarWinds® can help Database Administrators to meet their advancing Database monitoring and configuration challenges. This webinar...
Webinar On-Demand: SolarWinds Database Monitoring – Junior Database Administrators
In this webinar, you will discover how SolarWinds® can help Junior Database Administrators to meet their advancing Database monitoring and administration challenges. This...

