Journey to Full Observability: A step beyond Monitoring
What?
Observability is the next step up from Monitoring, where monitoring collects logs and performance metrics and then uses tools to track errors and send alerts. Observability goes even further and can help to resolve the problem by giving more detail about the possible root cause. These insights are built based on treating a complex computer platform as a single entity in other words based on holistic data performance.
SolarWinds Observability (SWO), is a ground up built application designed and delivered as a Software-as-a-Service (SaaS) platform allowing customers to benefit from an enterprise solution, with a much lower management overhead. A solution that supports the ingestion of monitoring data from SaaS solutions, cloud and on-premise infrastructure and application services. This is an integrated platform featuring modular options, ensuring effortless scalability to meet your evolving needs. As a cloud-based Software-as-a-Service (SaaS) solution, it operates much like Teams, Netflix, or Spotify—meaning the tool is instantly accessible upon login. This also means you don’t need to worry about keeping your system up-to-date, this is handled by SolarWinds, leaving you to get on with what matters, observability.
SWO has a single view of all entities as well as the ability to drill down to more detail giving a single pane of glass to observe various parts of your environment. These parts include Applications, Infrastructure, Logs, Databases, Digital Experience and Networks.
With Application Performance Observability, it can:
- Dive deep into the application stack, including code-level performance
- Reduce alert fatigue using AIOps-enhanced alerts
- Manage performance proactively again using Artificial Intelligence (AI)
- Identify performance bottlenecks using powerful troubleshooting techniques
- Simplify complex modern applications with a holistic view of health and performance status
- Deliver a powerful solution for application developers and DevOps teams to identify how their code performs
With Infrastructure Observability, it can:
- Deliver data-driven insights using AI
- Break down data silos gathering data from the cloud, container and virtualisation stacks, simplifying the issue and resolution
- Scale seamlessly as you add resources to your environments
- Surface issues affecting the technology tier that applications and services run on
With Logs Observability, it can:
- Provide context to event data using AI-driven insights.
- Spend less time troubleshooting using real-time search through as it happens data
- Use cloud-native frameworks with easy setup and third-party integrations
- Correlate log data side by side with event data to enhance your visibility and understanding to issues affecting your services delivery
- Manage risk with log archiving
With Database Observability, it can:
- Query responses before and after a deployment event
- Troubleshoot and diagnose outages by isolating unusual behaviour
- AI driven profiling to surface anomalous behaviour at the DBMS layer
- Understand database health by watching for trends in health summaries
- Using full-stack tracing and built-in intelligence we can simplify performance management
With Digital Experience Observability, it can:
- Using scalable Real User Monitoring (RUM) it can gain user insights for all web requests being processed by your web server engine
- Optimise performance by identifying emerging performance issues
- Test and optimise web elements using synthetic transaction queries
- Spot behaviour and usage trends
- Using automated wizards designed to guide you through the website setup you can get started quickly
With Network Observability, it can:
- Provide broad visibility across multi-vendor and multi-cloud networks by aggregating a comprehensive set of metrics into a single pane of glass
- Includes monitoring of the on-premise network and connections to the cloud provider’s infrastructure
- AIOps-enabled pattern recognition and anomaly detection, allowing teams to be more productive.
The level of capabilities outlined above demonstrates how many organisations are able to take advantage of such breadth and depth by reviewing their monitoring tooling and undergo a solution consolidation process.
Integrations
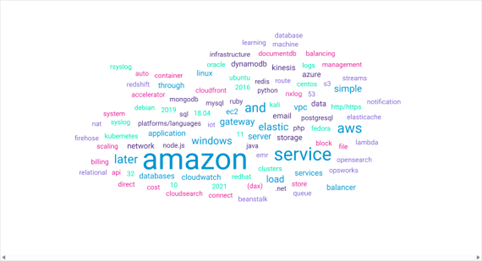
Lots of integrations built-in to the solution, see the image below to get more detail and what’s required.

How?
If you are used to running an on-premise monitoring solution, changing to a SaaS based solution will change how data is collected, but the concept of collecting data from all manner of endpoints, using the appropriate protocol for each is not too different. We may even be able to reuse your existing SolarWinds platform as the access point for the SWO platform, and if you use another vendors solution learn how this is architected to map in to how SWO is delivered. Do not worry, none of this is in any way daunting.
If you are new to Observability or even SolarWinds, then contact Prosperon and we can start you on your journey and discuss your observability requirements. We can help you understand what is required to take your first steps into observability within the SolarWinds platform.
If you use the on-premise or hybrid cloud platform, contact Prosperon with your current licensing and setup details. Let them know you saw this blog post and want to discuss your options. We can guide you through the initial steps and further exploration of transitioning to SolarWinds Observability.

Chris Dodds
Senior SolarWinds Engineer
Chris Dodds is a Senior SolarWinds Engineer at Prosperon Networks, and a SolarWinds THWACK MVP. As a SolarWinds Engineer, Chris helps customers meet their IT monitoring requirements with SolarWinds.
Demo: SolarWinds Observability
Demo: SolarWinds Observability
Enhance Database Monitoring with SolarWinds SQL Sentry
Recent Improvements to SQL Sentry In the fast-paced world of database management, staying on top of performance monitoring and optimisation is crucial. Database...
Database in Distress – important Database metrics on one screen with SolarWinds
Webinar: Database in Distress How to understand important Database metrics on one screen with SolarWindsIn this Webinar on Monday 5th June, you will discover how SolarWinds®...
Webinar On-Demand: SolarWinds Database Monitoring – Actual Bona Fide Database Administrators
In this webinar, you will discover how SolarWinds® can help Database Administrators to meet their advancing Database monitoring and configuration challenges. This webinar...
