Under The Radar: Device Not Replying To SNMPWMI/Agent
Finally, you discover that the node isn’t responding to SNMP/WMI for some reason. You reboot the device or restart the relevant services and resolve the issue but it’s left you annoyed because it’s taken time from your day which you already didn’t have, not to mention that the problem could re-appear on another device or server, or even the same one.
Luckily, there is a way to get SolarWinds to work for you to detect that a device may not be replying to the assigned protocol being used to monitor the node.
The first and essential method to utilise will start by making use of the alerting engine to notify us when Orion detects that a node’s data has not been updated for three consecutive polls. We can accomplish this by utilising the custom SQL trigger method, which allows us to create the necessary logic condition we are looking for.
First, let’s go over how to create the alert and refine it suit our needs. I’m going to structure the steps to accommodate new or basic users of SolarWinds so that everybody can follow along and take away some extra knowledge for this function:
Alert
We’re going to start by creating a new alert: Settings > Manage Alerts > Add New Alert
Alert Properties
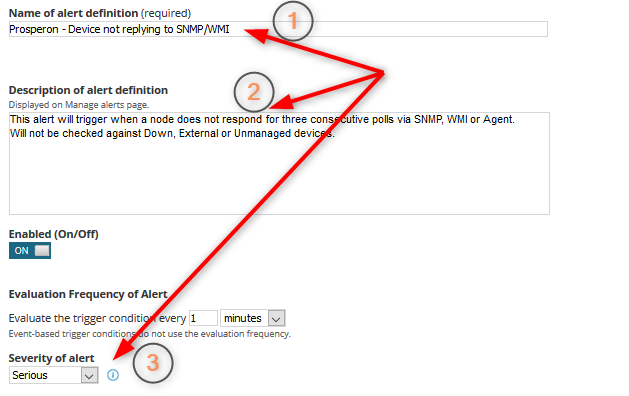
In the screenshot I have indicated the main aspects of the alert properties which need to be completed, which are Name, Description and the Severity of the alert. By default, the severity will be set to critical. You can adjust this to any other level according to preference. I have set this to Serious. Hit next to move on to the meat of the alert.
Trigger Condition
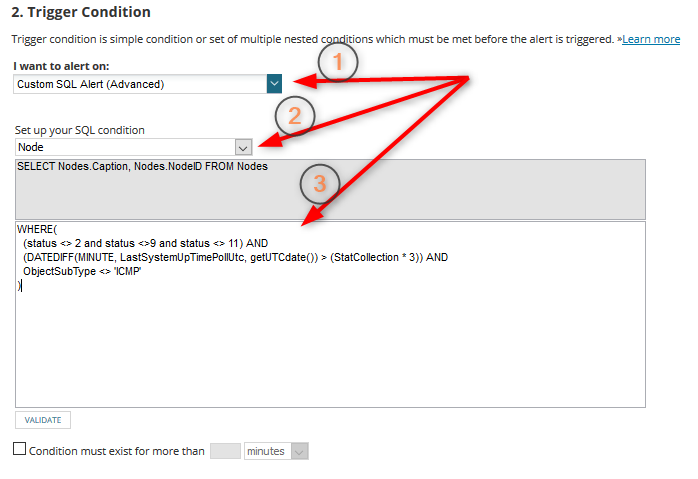
On the Trigger Condition screen, the first thing we need to change is the ‘I want to alert on’ field to ‘Custom SQL Alert’. The Custom SQL object type gives us more power over the pre-defined selections as it allows us to reference any parts of the database and allows us to formulate data in ways the GUI does not support. Expanding the selector will show you many options to choose from but the one we want is second from the bottom.
We’ll be defining our trigger condition to trigger when the following conditions are met:
- The node must not have a status of 2 (down), 9 (external) or 11 (unmanaged)
- The ‘LastSystemUpTimePollUtc’ value in the DB is greater than 3 polling intervals
- The polling method is not ICMP
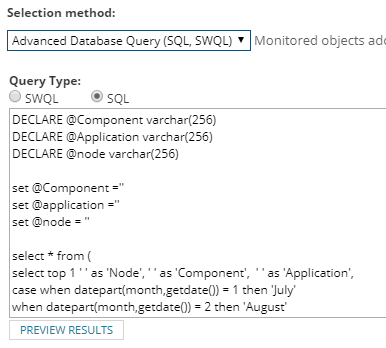
By default, the SQL condition is set to Node, so just confirm that Node is selected and we can move on to the query. Type in (or copy and paste) the following:
In the above query, we can see that the first line of the WHERE clause corresponds to point 1 of our conditions, likewise for line 2 and line 3. Hit next to move on to the Reset Condition.
Reset Condition
The Reset Condition screen is where we can define any criteria for when the alert should reset, for this alert we can leave it to reset when the trigger condition is no longer true. Hit next to move on to Time of Day
Time of Day
We are just going to hit next here without changing anything as we want this alert to be active 24/7.
Trigger Action
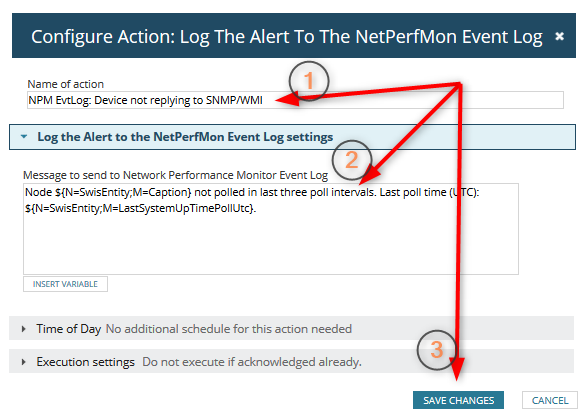
In the configure action window we need to give the action a recognisable name. This can be anything you like but try and make it something with some searchable keywords in case you need to find it in the Message Centre. ‘NPM EvtLog: Device not replying to SNMP/WMI’ should suffice.
In the message that we want to send to the event log, we should include (as a minimum) some useful information to help us identify the node that triggered the alert and the last time the node was updated.
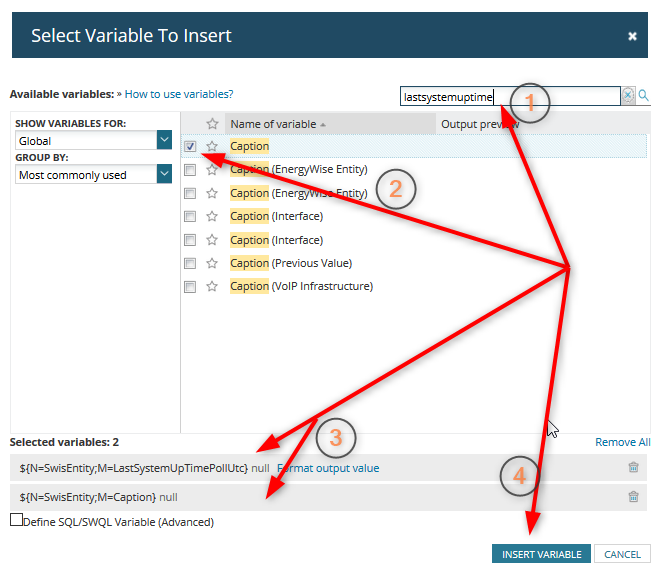
We need to use alert variables that the alerting engine will populate when the alert is triggered. Hit ‘Insert Variable’.
The two variables should now be in your message block. Continue you type out the rest of the message, feel free to copy mine from the screenshot then hit ‘Save Changes’.
Add a second action; this one will be ‘Send an Email/page’.
Once you’ve structured an email message that looks good, you can move down and confirm that the SMTP server is correct, or just leave it at the default server which can be configured under Settings > Configure Default Email Send Action. Hit Save Changes to add the action.
Now that we’ve got the two trigger actions for our node we can hit next to move on to the Reset Actions.
Reset Actions
The reset actions page is where we’re going to tell Orion what we want it to do if the alert resets. It’s not necessary for Orion to send us an email but best practice is still to have an Event Log reset action so that it’s trackable.
We could add a new action here and configure it as we did in the trigger action page, but here’s a trick – Just hit ‘Copy Actions from Trigger Actions Tab’. This will duplicate the trigger actions into your reset actions. Hit delete on the email action that it duplicated and then edit the reset action and add ‘- reset’ to the end of the name of the action. Hit next to confirm and move to the Summary page.
Summary Page
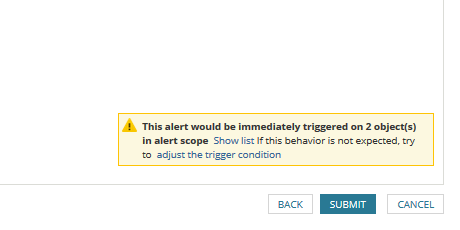
If you made it this far then congrats! All we need to do here is confirm all of our alerts settings and then most importantly, confirm in the bottom right corner how many nodes the alert will immediately trigger on based on the current trigger condition.
That’s it! You’ve created an alert which will detect if a device stops responding to SNMP/WMI or the Agent.
An alert isn’t what you want, you say? Well as well as or instead of an alert, we can create a report to provide details on devices in this condition.
While I would advocate that you use an alert as the method to identify devices not responding to management protocols, a report can be a useful resource to aid in this function.
Report
To create our report let’s head over to the reports page: Settings > Manage Reports then hit ‘Create New Report’
Next, we’ll name our report and then hit ‘Add Content’.
The add content window has many things we can choose from but two should already be listed, Custom Table and Custom Chart. Go ahead and select Custom Table and add it.
Now the query we’re going to use is slightly more complicated than the alert, this is because we need the query to help us present the data in a table. Copy and paste the following query into the text box:
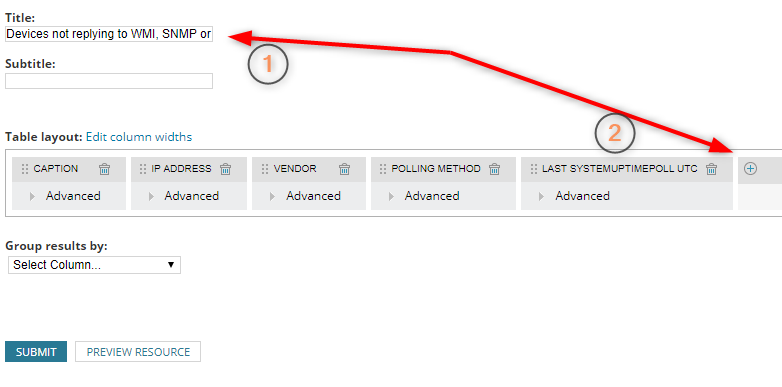
Lastly, give the Data Source a name and hit ‘Add to Layout’. You should now be back at the Layout Builder screen with our new table added. Hit ‘Edit Table’ so that we can the data columns.
There are a few things to do to make this an elegant report.
- Expand the Advanced section on Caption and select ‘Details Page Link’ on the Add Display Settings selector. Once that is added then tick ‘Enable Tooltips’, as this allows drilling into the Node details page directly from the report.
- Expand the Advanced section of Vendor and select ‘Vendor Icon’ from the same section.
- Expand the LastSystemUpTimePollUtc section and rename the column header to Last Poll TimeWithin the Order By option select Last Poll Time and change the Ascending value to Descending.
Once complete hit Submit on the table to take us back to the Layout Builder window. Once there hit next to move on to Report Preview
Report Preview
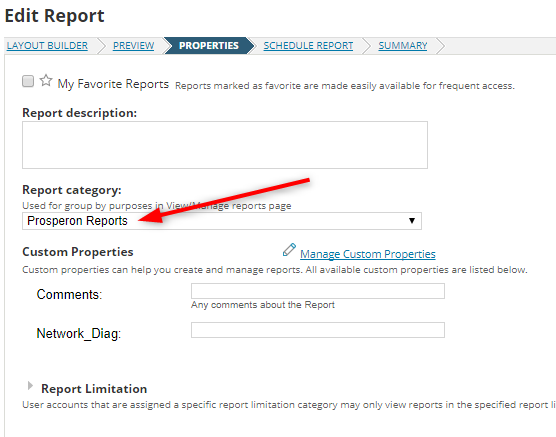
Properties
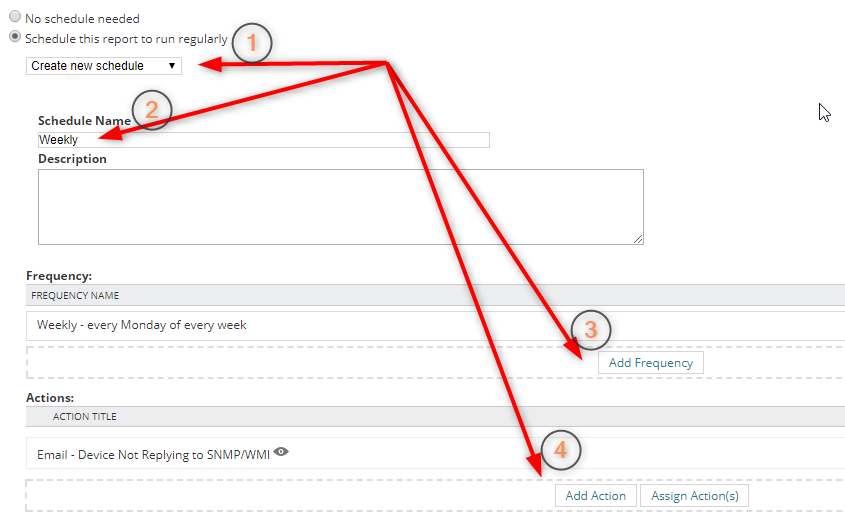
Schedule Report
Give the email action a name, specify an email address and put something in the body of the message, then submit. Hit Next to move to the Summary page. Confirm that everything looks good and Submit to create your report.
I have included an export of the alert and report definitions which are available to download via the links below. These can be imported into your own Orion installation should you wish to implement the content of this post quickly. Don’t forget to review the settings and adjust anything to your particular needs.
Custom Alert: Device Not Replying To SNMP/WMI/AGENT
Custom Report Definitions: Device Not Replying To SNMP/WMI/AGENT

Dax Attwood
Account Manager
As an Account manager at Prosperon Networks, Dax spends his time helping customers to optimise their IT Management capabilities, as well as keeping them up-to-date with the latest technologies and products..
Custom Alert: Device Not Replying To SNMP/WMI/AGENT
Custom Report Definitions: Device Not Replying To SNMP/WMI/AGENT
Related Insights From The Prosperon Blog
Don’t get lost! Mapping your Network with SolarWinds
Heard of SolarWinds Intelligent Maps and never known where to start with them? You’re in luck! Join us as we chart a course……sorry I couldn’t resist! Let’s navigate through...
The Critical Role Of The Trusted Advisor In NetOps
Before there was “Network Operations” there were networks. Networks grew out of a need for connecting one box to another, sharing printers, and for more advanced users,...
Webinar On-Demand: Beyond Monitoring – Introducing SolarWinds Observability Platform
In this webinar, you will discover how SolarWinds® is evolving to deliver complete infrastructure visibility. This webinar examines how to extend visibility across your IT...

