The March Continues: An Introduction To SolarWinds Server Configuration Manager
This is not a history lesson, but an introduction to the fact that since then SolarWinds has created the Orion platform and turned this into a monitoring and management behemoth. A platform that is modular in design and has grown and grown, moving away from purely a network focused solution to a solution that monitors everything that has any sort of service connectivity in an organisation. Add in there a mix of management functions as well and it is no wonder why SolarWinds has over 275,000 customers around the world.
Orion which now contains a total of 12 full modules and 3 integrations to other SolarWinds applications, with the 12th being the latest new addition to the fold: Server Configuration Monitor.
This is a ground-up Orion module, which has been built to provide a method to identify and create a record of changes applied to servers. This is important because human errors and changes to systems are consistently in the top 3 reasons for loss of services within IT. Keeping on top of changes, knowing when things change, what has changed and what it changed from.
In a time-honoured traditional the module is itself modular in the sense that it has out of the box functionality and the ability to be extended via the built-in customisation. Referred to as profiles, in the first release of SCM, there are 7 provided profiles; folder content, Windows firewall, IIS, Orion SDK, Registry, Hardware, and Software. Certainly a fundamental for system changes is the adjustment to hardware and software, but with IIS, this is looking inside an application configuration for changes.
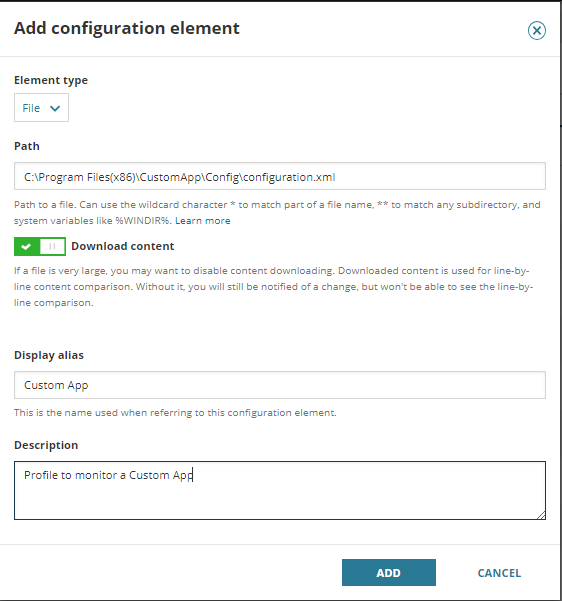
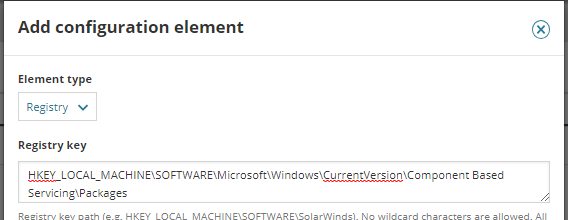
Creating your own profile allows you to define your own system or application change detectors, with capabilities to monitor file and registry changes. All it takes is identifying the files and registry settings that have an impact on the configuration of a system or application and very quickly you can build a set of entries to monitor them.
The baseline feature built into SCM allows not just for changes since the data was last collected to be performed but allowing a defined point in time to be used as the comparison point. This may be something straightforward as creating a known secure point in configuration or that your organisation is starting a change freeze period and therefore any changes identified from this point forward can be quickly identified, reported and understood.
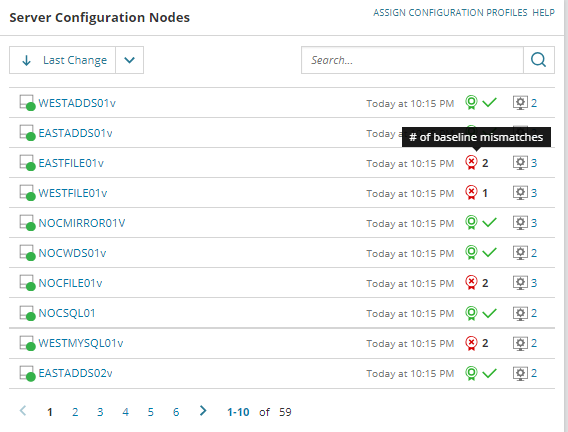
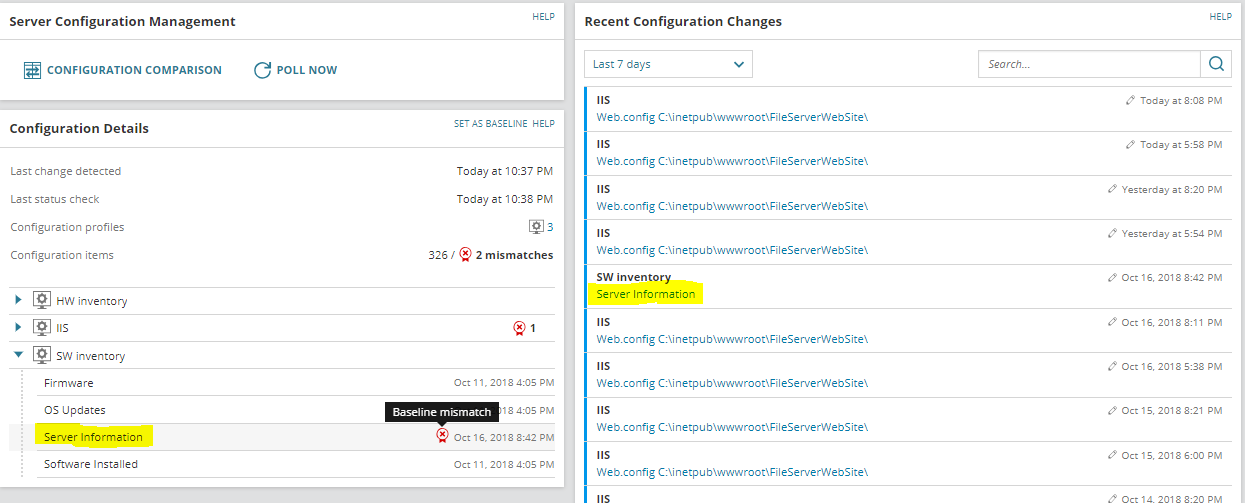
The above screenshot clearly shows a server with 2 configuration differences to the baseline defined on it. Let’s go and look at what has changed here. The information is available within the familiar Node Details page for the node device as a sub-tab menu page.
Product Trial: SolarWinds Server Configuration Manager
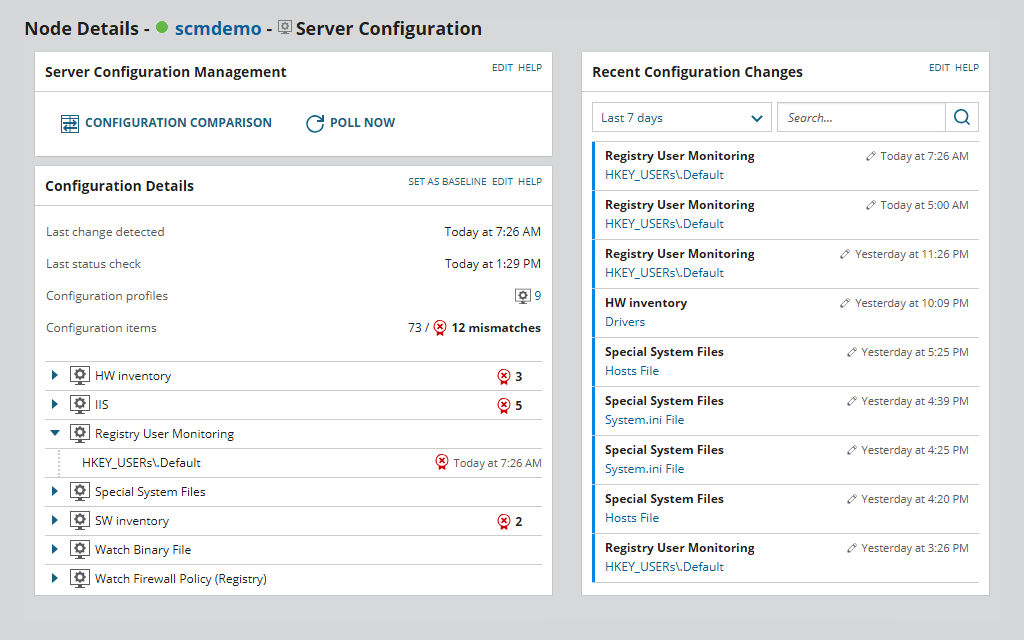
Drilling into the change detected reveals the true detail of the change, so in this example, we can see that the server had more memory added to it.
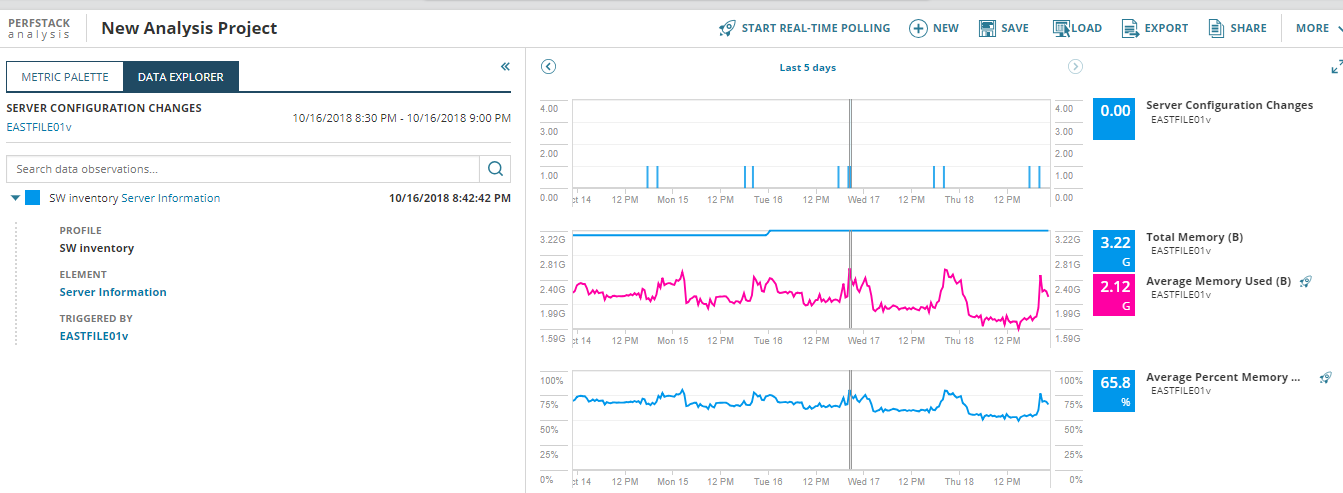
One last feature to show you and I highly recommend you look at a previous video of ours where we show off the marvellousness of the PerfStack area of Orion. Here we are using Perfstack to populate Orion NPM metric data with SCM identified configuration changes. Notice the blue towers in the top chart, these are the individual changes, which can be highlighted to give the details on the left sidebar, how cool is that?!
Continuously monitoring for changes and being able to correlate this with other Orion monitoring data provides such insight into root causes of issues affecting the health, performance, and security of your servers and the services they deliver to your business.

Mark Roberts
Technical Director
Mark Roberts is the Technical Director at Prosperon Networks and a SolarWinds MVP. Mark has been helping customers meet their monitoring needs with SolarWinds IT Management Solutions for over 14 years.
Product Trial: SolarWinds Server Configuration Manager
Enhance Database Monitoring with SolarWinds SQL Sentry
Recent Improvements to SQL Sentry In the fast-paced world of database management, staying on top of performance monitoring and optimisation is crucial. Database...
Database in Distress – important Database metrics on one screen with SolarWinds
Webinar: Database in Distress How to understand important Database metrics on one screen with SolarWindsIn this Webinar on Monday 5th June, you will discover how SolarWinds®...
Webinar On-Demand: SolarWinds Database Monitoring – Actual Bona Fide Database Administrators
In this webinar, you will discover how SolarWinds® can help Database Administrators to meet their advancing Database monitoring and configuration challenges. This webinar...

