Don’t get lost! Mapping your Network with SolarWinds
Heard of SolarWinds Intelligent Maps and never known where to start with them? You’re in luck! Join us as we chart a course……sorry I couldn’t resist! Let’s navigate through some topics….right, sorry – I have it out of my system now! Here is what you need to know.
If you have worked with SolarWinds for some time the name ‘Network Atlas’ might be a familiar one. This was a dedicated application provided by SolarWinds to create custom network maps. The tool was officially deprecated in version 2020.2 but has stuck around to allow maps to be migrated into the SolarWinds platform. We’ll look into this a little more below.
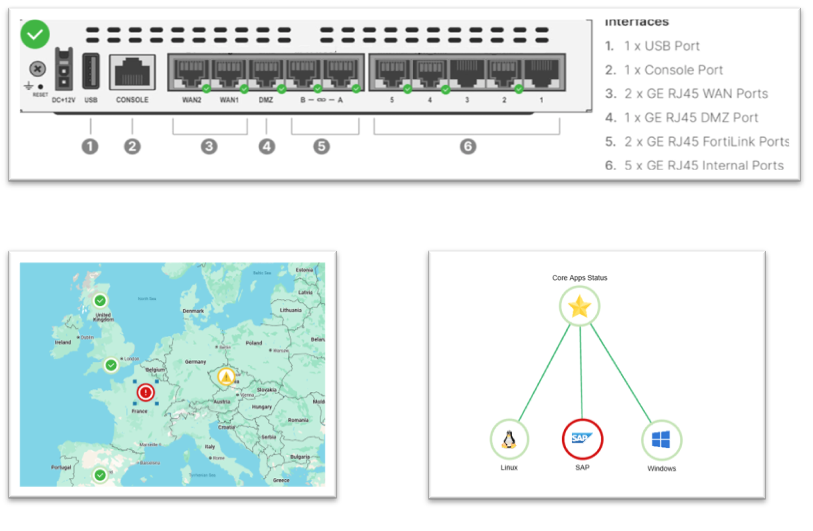
SolarWinds Intelligent Maps, which are entirely web-based, provide a dynamic canvas that allows you to create a visual representation of your device’s topology and health. Here are a few examples of making these maps work for you.
Ready, Steady, Create!
From within SolarWinds, navigate to ‘My Dashboards > Home > Maps’. Here you will see any maps already created. You’ll also see options for creating new maps and importing maps from Network Atlas.
Selecting ‘New Map’ will load the canvas we spoke about earlier. Here is where the magic begins! Let’s quickly talk about what you can place on the map. Under ‘Entity Library’ over on the left, you can select from a HUGE list of categories such as Node, Application, Interface and many more. In our example, we are going to be selecting from Node. Now, I love a bit of drag and drop, so once you find your devices drag those over onto your canvas.
Remember that magic I spoke about? Well, if you have topology information being collected from your devices and you drag two devices that are known to be connected, you’ll see that reflected.
Let’s take it up a notch and add some other entity types to this map. As with many of our servers you likely have applications on them that need monitoring to ensure a reliable service is provided. Well, using our filters on the left, we can find those applications being monitored on one of our devices and drag them into view.
Once you have your entities on the map, you can begin customising how things look. Using the options on the right side of the canvas, we can change text, icons and even upload background images. That’s right folks! Want your devices to look as though they are being swallowed up by a sea creature whilst providing useful health metrics?!…..the world really is your oyster!
Another helpful feature on the right side is the ability to pull through polled values. With an entity selected, you can use the ‘content’ section to view the values that relate to your selected entity. You might want to pull through the IP address or the current CPU load as an example.
As I bring us into port, let me leave you with a few tips and tricks for using Intelligent Maps.
- Make use of services like Google Maps or Map Quest to place your entities in their geographical location. You can do this by using a screen grab and uploading it as a background.
- Once you have a map, why not add it to a Modern Dashboard for your colleague’s viewing pleasure? These work great for Service desks and managers to have a quick traffic light style glance at system health.
- Find out more about Intelligent Maps from SolarWinds
Map your Network with us!

Matt Thompson
Snr. SolarWinds Engineer
Matt is a Senior SolarWinds Engineer at Prosperon Networks. As a SolarWinds Engineer, Matt helps customers meet their IT monitoring requirements with SolarWinds.
Map your Network with us!
Related Insights From The Prosperon Blog
The Critical Role Of The Trusted Advisor In NetOps
Before there was “Network Operations” there were networks. Networks grew out of a need for connecting one box to another, sharing printers, and for more advanced users,...
Webinar On-Demand: Beyond Monitoring – Introducing SolarWinds Observability Platform
In this webinar, you will discover how SolarWinds® is evolving to deliver complete infrastructure visibility. This webinar examines how to extend visibility across your IT...
An Introduction To SolarWinds Orion’s Device Configuration Compliance Reporting
Needless to say, it is critical that the all network devices in your organisation are secure and available at all times. However, configuration changes and adding new...


