SolarWinds PerfStack – What Is It & How To Use It
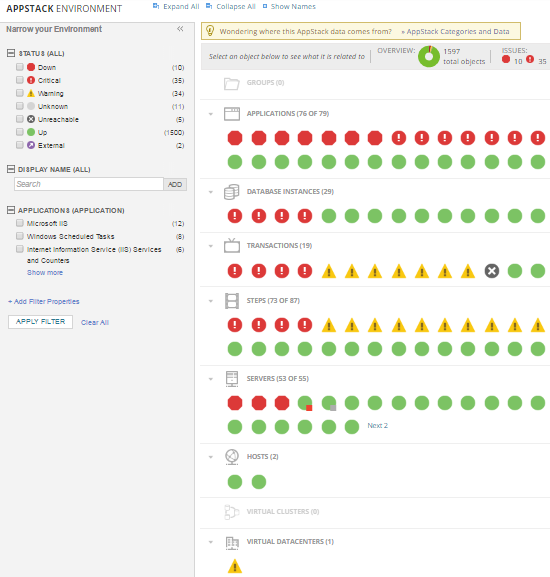
For those of you already using SolarWinds, you have no doubt seen and used the AppStack feature. AppStack allows infrastructure across several SolarWinds modules to be visually displayed as correlated entities, giving you visibility of what application is running on which server, on which host, off which datastore, off which SAN, off which LUN etc. etc.
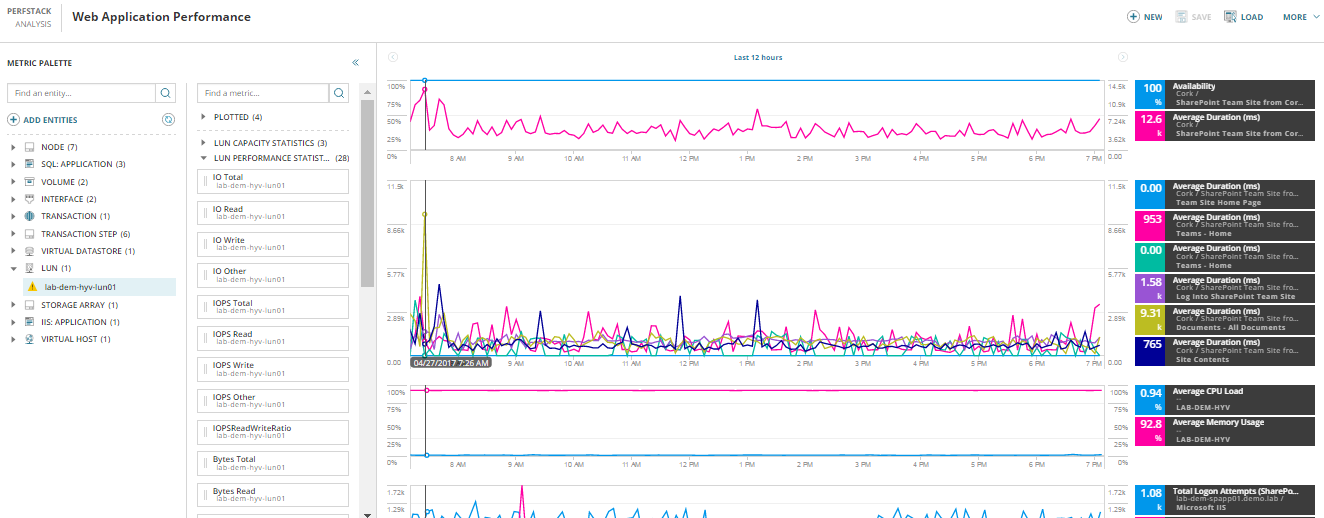
PerfStack
As I mentioned, this is a SolarWinds core platform feature which means it is available across many of the SolarWinds modules. NPM, NCM, NTA, SAM, VMAN, and SRM all have their data metrics available for dynamic display on this correlated charting dashboard. The first three applications in the above list are network device focused and the last three are system and operations. Yes, you’ve got there already. Consider the ability to create a visual data chart which displays metrics across all these devices and systems and how everyone supporting the IT infrastructure can see for themselves just where the issues lay.
How you can use it
There are too many to list, but let’s put a quick example together. You have an application, it could even reside in the cloud (SAM has new cloud monitoring capabilities in v6.4), which from the top down has:
- 3 server presentation farms running on IIS
- 2 Java middleware servers
- 2 SQL servers for the data layer running as ‘Always on Availability Group’
- A path of 4 network devices connecting this to the business from the data centre; switches, router and firewall
- An F5 load balancer managing connections to this IIS farm
Not such an uncommon configuration, but one which SolarWinds is probably collecting more than 300 individual monitor data metrics from. Some of these are the Key Performance Indicators for this service entity, such as the status and throughput of the F5 LTM, SQL query wait times, bandwidth on the router, sessions on the firewall, memory management on the Java, disk performance on the LUN and Pools off the SAN. Put all of this on a series of charts, which when you hover over one metric all the other metrics are displayed for that single point in time together in one easy to digest manner and you have a recipe for the truth.
I foresee two main uses for PerfStack:
- Creating a saved dashboard which has all the metrics relevant for a system or service, and contains the data values across disparate devices, servers and applications. This dashboard can then be viewed by anybody with access (yes, PerfStack adheres to account limitations) who can review and identify across this correlated time window the values that may indicate issues.
- When issues arise, coming to PerfStack and building an Ad Hoc dashboard which you can add metrics to as you go. As you build out the display the truth becomes clear to see, allowing for nice speedy mean time to resolution (MTTR).
For the latter use, training is going to be essential to empower your IT team to build out a PerfStack dashboard and troubleshoot issues. Issues that they can either deal with immediately themselves or provide the information to the SME who can confirm and remediate against the issue quickly and efficiently.immediately themselves or provide the information to the SME who can confirm and remediate against the issue quickly and efficiently.
If you’ve been on one of our training courses, you would have heard me say that restricting users who can edit page layouts is important. PerfStack changes this completely, as users can do everything they need in the PerfStack dashboard area; including collating data across metrics on all your devices to uncover service impacting nuggets of information. Give them the knowledge to do it themselves!
Must be hard to create right?
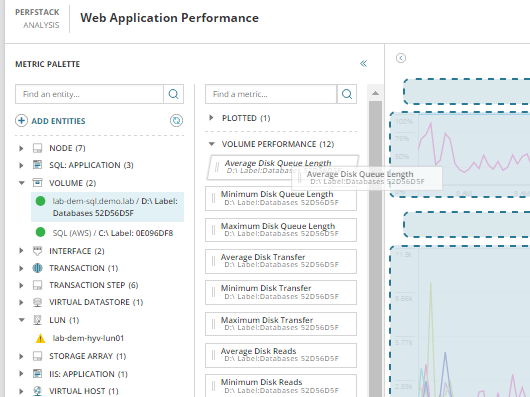
Ye, NOT! Troubleshooting and buiding out correlated charts is a simple Drag and Drop affair. The most difficult this and this comes down to SME knowledge more than the tool, is understanding what metrics are beneficial to display on the dashboard.
Another really neat feature of PerfStack is the ability to Save and Share, which is so straightforward as anyone can copy and paste a URL. OK, so I know you all know someone especially if you’ve worked on a service desk, but certainly anyone that will benefit from this information. Simply create your dashboard project copy the URL and send that to the person(s) that can help with the troubleshooting and fix.
Training Course: SolarWinds Training Courses

Mark Roberts
Technical Director
Training Course: SolarWinds Training Courses
Related Insights From The Prosperon Blog
Don’t get lost! Mapping your Network with SolarWinds
Heard of SolarWinds Intelligent Maps and never known where to start with them? You’re in luck! Join us as we chart a course……sorry I couldn’t resist! Let’s navigate through...
The Critical Role Of The Trusted Advisor In NetOps
Before there was “Network Operations” there were networks. Networks grew out of a need for connecting one box to another, sharing printers, and for more advanced users,...
Webinar On-Demand: Beyond Monitoring – Introducing SolarWinds Observability Platform
In this webinar, you will discover how SolarWinds® is evolving to deliver complete infrastructure visibility. This webinar examines how to extend visibility across your IT...


