SolarWinds Alerting Tips – How to Minimise False Alerts
One of the common pains in the monitoring world is alerting, and more specifically how to avoid being flooded with false alerts.
What is an Alert
Before we start reviewing how to minimise false alerts, we should define what a false alert is, and in order to do so, first of all, we need to define what an alert is.
An alert is an event that occurs within a monitoring solution where it identifies a potential status or health issue within the ICT infrastructure that can potentially generate issues or problems. Hence a false alert is when an alert is generated but there is no potential issue assigned to that event.
What kind of event can generate a potential issue? Well, this is a tricky question, because what a potential issue looks like will differ among different people and different infrastructure. For some people having a device with CPU 100% is a potential performance issue, whereas for others this is an acceptable condition. There is, and never can be, a one size fits all when it comes to the conditions that require an alert to be generated.
How to Minimise False Alerts in SolarWinds
Can we eliminate all false alerts? I’m afraid this is a very difficult task, however, we can try to minimise them using some techniques and features that we have in SolarWinds® Orion alerts.
We have the following tips for you:
- Monitor what you really need
- Create only meaningful alerts
- Use time delays before triggering
- Use object level thresholds
- Filter common offenders
- Take advantage of Complex conditions
- Custom SQL/SWQL definition alerts
Monitor What You Really Need
It is very impressive when you talk to your colleagues and you tell them how you manage to gather 300+ different metrics from your switch, but, in reality, do you really need everything. Do you just need to know the traffic utilization of the interfaces, CPU/Memory and the VLANs configured?
Monitor only what you really need will avoid temptations of creating alerts for metrics that you don’t really need.
Create Only Meaningful Alerts
Even though you have picked carefully the metrics you really need, it doesn’t mean that all the metrics need an alert assigned.
For example, it is very useful to know how many people are connected to one of your websites. This allows you to correlate this value with other metrics such as database activity, website response time, etc…, but you probably don’t need to receive an alert when the number of users connected is higher than XX. Include this information in the alert output when the performance of the website is poor, but don’t trigger on this single threshold.
Use Time Delays Before Triggering
One simple but powerful trick to reduce the alerts is waiting some time before triggering the alert. This way we make sure the condition that we have defined is true for a continuous period of time, avoiding alerts generated by spikes.
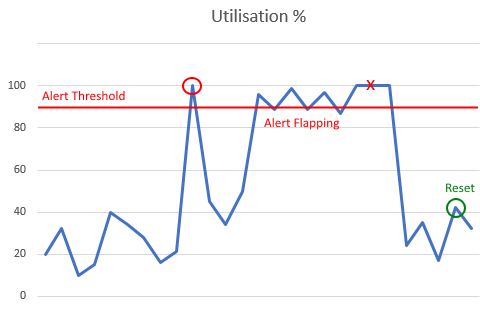
For example, where you are monitoring metrics such as CPU load or interface traffic, it is better to wait for one, two, or even more polling intervals before triggering the alert. Otherwise, just a spike of CPU can potentially trigger an alert when that situation is not a potential issue on your network. In the diagram above, the default High CPU alert would have triggered, when in fact the red cross is a more appropriate point to fire an alert.
On the alert Trigger page, utilise the following setting, converting the polling frequency into a value here, for example, 600 seconds would guarantee at least 2 polls of data are evaluated on a node statistic value polled every 10 minutes.
Use Object Level Thresholds
I think that configuring an alert that is triggered when any volume percentage of space used is more than 95% is a good idea. Full disks are a clear issue on your network because it can stop applications, not allow backups to be stored, etc.
However, what happens with disks that are 10TB+ of size? 5% would mean at least 500GB free space available, and I’m sure you don’t want to receive an alert when a disk still has more than 500GB capacity.
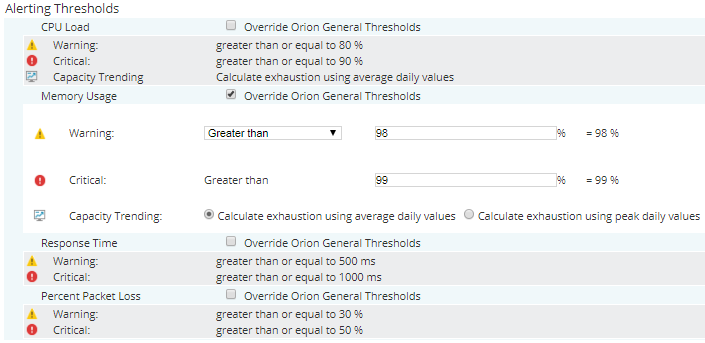
Using custom thresholds would allow you to receive only alerts when the problem is real. In SolarWinds there are two ways to use custom thresholds:
- Built-in custom thresholds: available on some metrics such as CPU, memory, packet loss, interface traffic, errors and discards, custom pollers, SAM components, VM metrics,…
- Using custom properties: for any other metric that doesn’t have a built-in custom threshold, you can create custom properties to be used as custom thresholds. Examples: percentage disk space used, temperature, connections,…
In some situations, the techniques mentioned above will not be enough to avoid receiving alerts from those devices where, for example, having 100% CPU load for 2 hours is kind of normal.
In those situations, the best way to move forward is to eliminate the option of that device triggering the alert. There are two main options here:
-
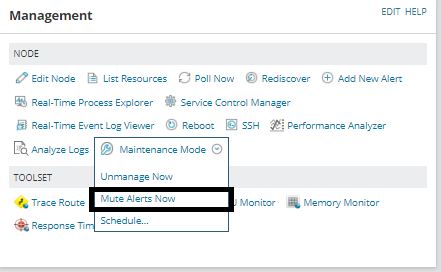
- Mute alerts on that device: this device will stop triggering any alert. Bear in mind that any alert means any alert.
- Editing trigger conditions
- Create a Custom Property to which you can use as a filter to exclude from common alerts
- Priority, for example, could work well for this, where this is an integer and the definition states ‘is not equal to’ 3
Take Advantage of Complex Conditions
In some situations, one way to configure the ultimate alert that you need is by using ‘complex conditions ’. This is an option available in SolarWinds that allows you to create more complex trigger conditions. This feature allows us to:
- Trigger when at least more than one device/object is triggering the alert: for example, trigger the alert when there are at least two devices from a cluster down
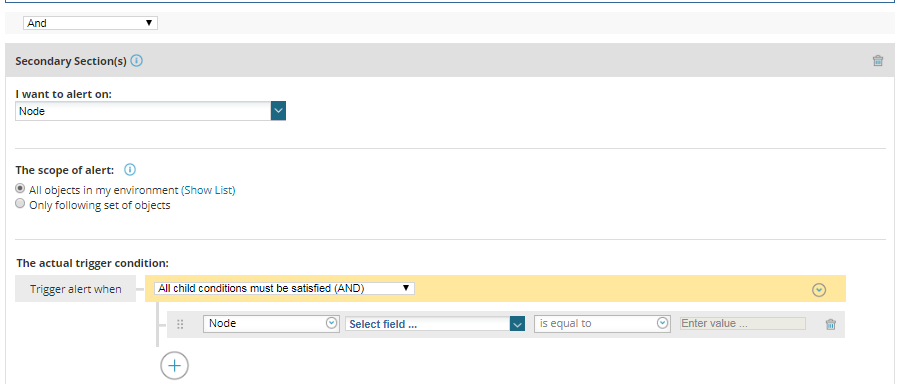
- Additional sections: allowing you to mix conditions from different types of objects. For example, alert me when the VM latency is high but the latency of the VM datastore is not high.
I personally use this feature when I use alerts to trigger automation processes for self-healing purposes, as this feature allows you to be very (very) specific on when to trigger the alert.
However, today’s topic is not how to use SolarWinds alerts to automatically self-heal your network, we will leave this discussion for another day.
Custom SQL/SWQL Definition Alerts
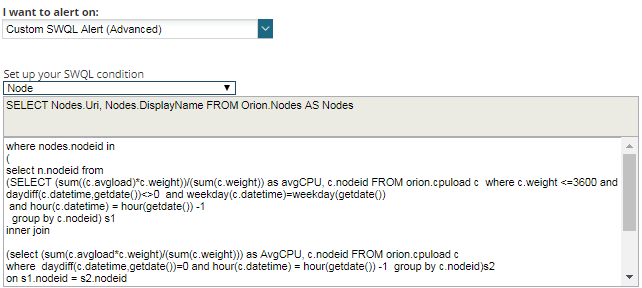
When all the options above are not helping you to create the alert you need, then you should try using SQL/SWQL alerts.
This is the most flexible option mentioned on this blog, but also the most complicated, as it requires SQL/SWQL query skills and knowledge of the SolarWinds database schema. However, this way to create the alert will allow you to define (almost) any type of alert.
This type of alert is commonly used when you need to achieve the following:
- Alerts involving historical data: common conditions only alert using the last value polled (unless you use the option of a wait before trigger), but what if you need to trigger an alert based on the average value for the last xx hours?
- Complex filters: when an alert becomes extremely long or complex using any of the other methods, using SQL/SWQL will potentially make it easy to configure. You are in control of the logic
Training Course: SolarWinds Training Courses

Raul Gonzalez
Technical Manager
Raul Gonzalez is the Technical Manager at Prosperon Networks. As a Senior SolarWinds and NetBrain Engineer for over seven years, Raul has helped hundreds of customers meet their IT monitoring needs with SolarWinds and NetBrain Solutions.
Training Course: SolarWinds Training Courses
Related Insights From The Prosperon Blog
Don’t get lost! Mapping your Network with SolarWinds
Heard of SolarWinds Intelligent Maps and never known where to start with them? You’re in luck! Join us as we chart a course……sorry I couldn’t resist! Let’s navigate through...
The Critical Role Of The Trusted Advisor In NetOps
Before there was “Network Operations” there were networks. Networks grew out of a need for connecting one box to another, sharing printers, and for more advanced users,...
Webinar On-Demand: Beyond Monitoring – Introducing SolarWinds Observability Platform
In this webinar, you will discover how SolarWinds® is evolving to deliver complete infrastructure visibility. This webinar examines how to extend visibility across your IT...

