Is There Something Abnormal In Your Network? Baseline It with SolarWinds!
The following week, at another customer, the IT director’s boss came down to the networks department asking when the network is less busy. This company was thinking about doing some stress tests on the network, and he was asking when the best time of the week to perform these tests is. This created a bit of a discussion as some guys immediately replied that the weekend is when the network is less busy, but some other mentioned all those backup jobs configured on Saturday and Sunday. In the end, there was no consensus and the IT director left a little bit frustrated with the situation.
These are just two of the multiple scenarios where IT engineers need to know what is ‘normal’ in the network infrastructure and what is not. In order to find anomalies in your infrastructure, it is essential to have an understanding of what the baselines are.
Baseline your network
The question now is how we can baseline our network traffic, as collecting data is the essential ingredient here. If we have SolarWinds (for this example we will use SolarWinds Network Performance Monitor, however depending on the metric you want to baseline other modules will be required. The tool will store in the database every time we poll data from our network during the retention period. In plain English, this means that SolarWinds will keep historical data of the metrics we get from the devices we are monitoring.
In this example, if we need to baseline interface traffic, I would recommend getting the average of traffic per hour and per weekday. This makes sense to me as, normally, IT engineers create admin tasks with daily or weekly frequency. For example, we take VM backups daily at 23:00 or running configs of our network devices on Sunday at 02:00. If you guys create tasks with a different frequency (say monthly), I would recommend baselining your network based on that frequency (for example based on the day of the month).
Steps to display your average weekday traffic
Having the option to see what is normal and what is not in my network sounds great to me, but the question remains the same: how can we display the data we want on the format we need?
SolarWinds Orion gives us a lot of options to display the metrics we are polling from our network devices, and in situations where we need something a little bit more customized (like the current one) we can use SWQL/SQL queries to display the information the way we need.
If you want to display the average traffic per hour and per weekday on a SolarWinds view, please follow these steps:
NOTE: if you want to create a report instead of a SolarWinds view, the steps are quite similar
- Go to the dashboards you want to edit in SolarWinds
- Customize page
- Add new widget
- Create a custom chart
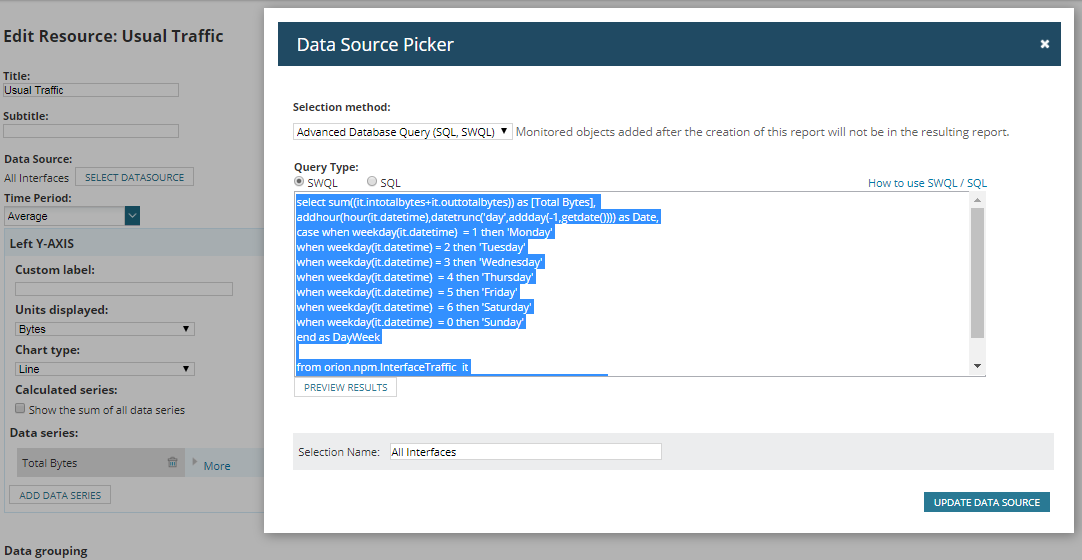
- Datasource -> Advanced Database Query -> SWQL
- Enter the following query:
Custom Script: Average Traffic Weekday
- Time Period: Custom
- Named time period: Average
- Relative time period -> Last 1 DaysData Series: Total Bytes
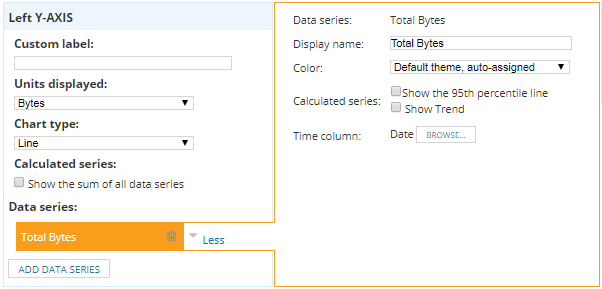
- Data Series: Total Bytes
- More -> Time Column -> Date
- Units displayed: Bytes
- Group chart data by: DayWeek
- Legend shows: DayWeek
- Sample Interval: Every hour
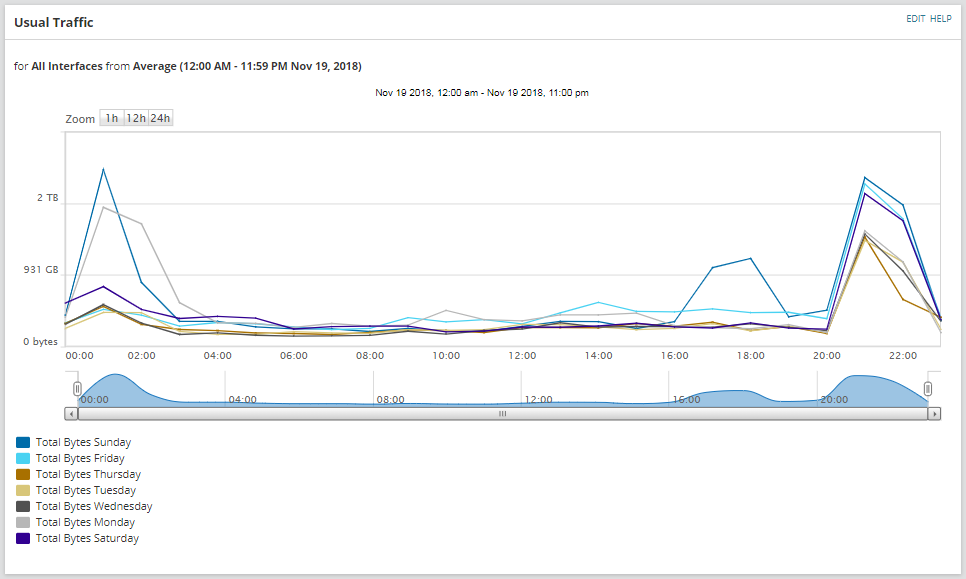
If you have followed the steps above, the chart should look like something similar to this one:
Based on the chart above, we can see that every day we have a spike of traffic around 21:00, and a similar amount of traffic on Sundays and Mondays around 01:00. This makes sense as every day at 21:00 is when we back up our VMs to our internal backup server and on Sundays we backup the VMs to the cloud. However, it is not clear why we have the same spike on Mondays, probably a misconfiguration that I will need to review internally.
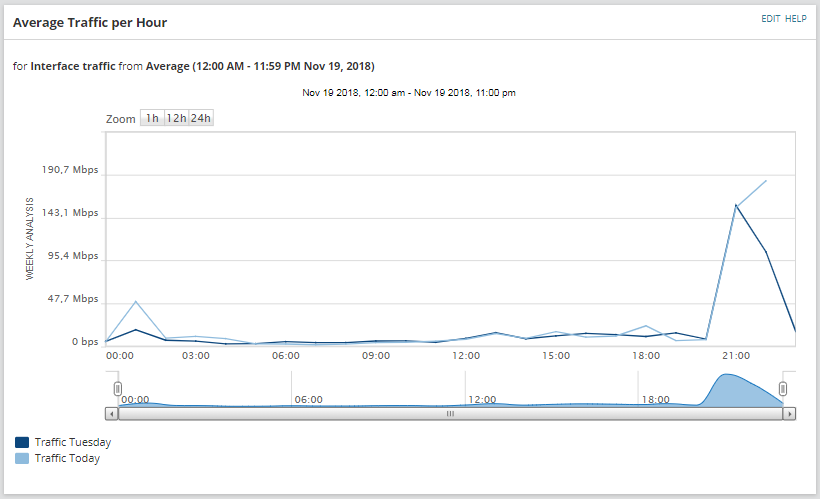
What if we want to profile the traffic of one single interface? That is also possible using the following script, with the same steps described before, just add the widget on the Interface Details View (view displayed when you click on any monitored interface).
Bear in mind that now we are displaying bits per second, and not total bytes, therefore in ‘Units displayed’ select Bit/s.
Custom Script: Average Traffic Weekday - The Interface
Other Baselines
To be fair, any metric that is monitored in SolarWinds can be baselined as shown above. Think about what is important in your network and create the chart that will display the data you need. Metrics like the following are good candidates to baseline:
- CPU load
- Volume space used
- Availability
- Virtual Machine latency
- Volume IOPs
Thank you for your time reading this article, and please let us know which metrics you would like to baseline in your network.

Raul Gonzalez
Technical Manager
Raul Gonzalez is the Technical Manager at Prosperon Networks. As a Senior SolarWinds and NetBrain Engineer for over seven years, Raul has helped hundreds of customers meet their IT monitoring needs with SolarWinds and NetBrain Solutions.
Custom Script: Average Traffic Weekday
Custom Script: Average Traffic Weekday - The Interface
Related Insights From The Prosperon Blog
Don’t get lost! Mapping your Network with SolarWinds
Heard of SolarWinds Intelligent Maps and never known where to start with them? You’re in luck! Join us as we chart a course……sorry I couldn’t resist! Let’s navigate through...
The Critical Role Of The Trusted Advisor In NetOps
Before there was “Network Operations” there were networks. Networks grew out of a need for connecting one box to another, sharing printers, and for more advanced users,...
Webinar On-Demand: Beyond Monitoring – Introducing SolarWinds Observability Platform
In this webinar, you will discover how SolarWinds® is evolving to deliver complete infrastructure visibility. This webinar examines how to extend visibility across your IT...


