How to Use Baseline Calculations in SolarWinds
Dynamic thresholds do not rely on a single, static value set on a case-by-case by individual users, nor do they depend on a single one-size-fits-all global default. These dynamic thresholds are calculated based on real metrics polled from the object in question. They change over time, adjusting depending on the values captured for the metric in question, with data figures relative to the last 7 days. This is of significant benefit, as the correlation to true usage data allows for anomalous increases in resources to be identified i.e. a deviation from what is ‘learnt’ to be normal.
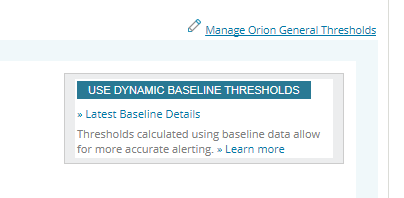
Here, we are going to look at how we can take advantage of calculated baseline values within SolarWinds®.

When using dynamic thresholds, the background processes are doing the following:
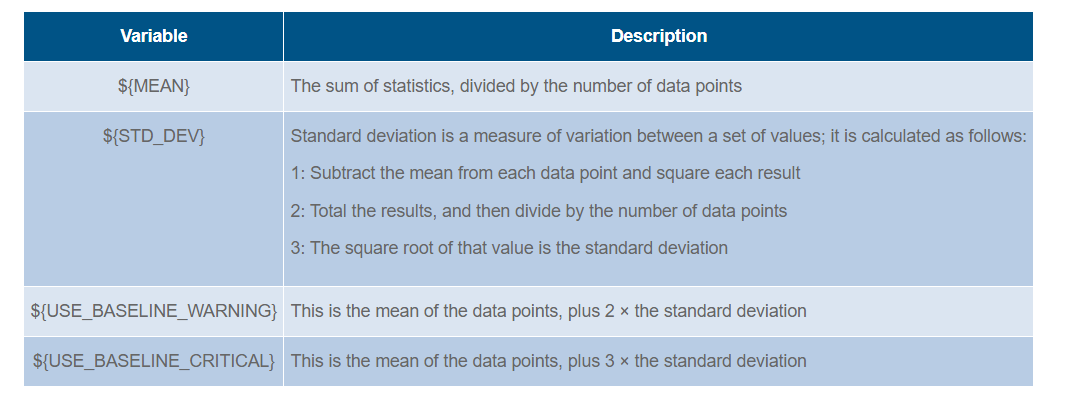
- SolarWinds works out the mean average of the data points (the sum of the metrics divided the number of data points).
- SolarWinds calculates the standard deviation (the distance between the data points and the mean are calculated; these values are each squared, summed up, and then divided by the number of data points; the square root of this figure is the standard deviation).
We can reference these dynamic thresholds using the following variables:
For example, you might be monitoring the interface utilisation on a firewall. The utilisation can vary drastically depending on the time of year, the time of day, the number of users, and many other factors.
Alerting for this metric for some values should be based on sudden and unusual spikes, in the worst case perhaps indicating a DDoS attack or user profile that does not meet your available resources. Imagine that over the Christmas period many in the business are on holiday and activity through the firewall is reduced. If there is an unusual spike in connections, this might fall below a static threshold (likely set based on expected values for a busy period). However, dynamic thresholds would pick this up, informing you that the number of connections falls outside the norm for that period, warranting investigation.
Of course, the default warning and critical dynamic thresholds can be customised even further. Let’s say that the 3 × standard deviation is a bit tight for a particular metric. Perhaps only the very greatest jumps in values polled might be worth breaching a threshold. In this case, the ${USE_BASELINE_CRITICAL} can be replaced by other variables:
[code]${MEAN}
${STD_DEV}[/code]
In this way, your critical threshold could contain the following formula to represent a threshold value of 10 × the standard deviation above the average:
[code]${MEAN} + 20 * ${STD_DEV}[/code]
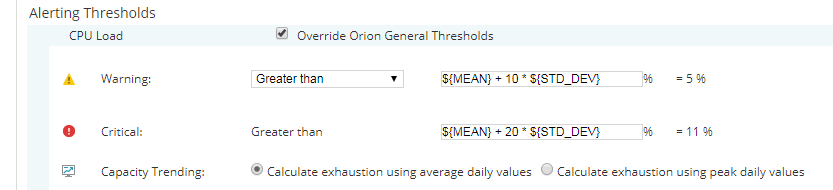
This gives you even more control over your thresholds than the ${USE_BASELINE_CRITICAL} variable – if you are going to break the mold with dynamic thresholds, don’t pass up the opportunity to apply your own calculation!
One other noteworthy part of dynamic thresholds for the Server and Application Monitor module is that the time period which is used for calculation can be modified:
- Go to Settings > SAM Settings
- Click on Polling Settings in the Thresholds & Polling section
- Scroll down to the Database Settings and adjust the days in the Baseline Data Collection Duration field
Note: The Baseline Data Collection Duration cannot exceed the Detailed Statistics Retention
Hopefully, this article has proven useful to you for fine-tuning your environment for dynamically adjusting thresholds. When it comes to alerting, default thresholds which don’t account for the nature of your environment have a huge impact – I heartily recommend reviewing this great feature. We look forward to hearing your thoughts, and all expect to see you on Thwack to continue the dynamic SolarWinds discussion!
Training Course: SolarWinds Training Courses

Robert Kavanagh
Snr. Monitoring Engineer
Robert Kavangh is a Senior Monitoring Engineer at Prosperon Networks. As a Senior SolarWinds Engineer for over five years, Robert has helped hundreds of customers meet their IT monitoring needs with SolarWinds Solutions.
Training Course: SolarWinds Training Courses
Related Insights From The Prosperon Blog
Don’t get lost! Mapping your Network with SolarWinds
Heard of SolarWinds Intelligent Maps and never known where to start with them? You’re in luck! Join us as we chart a course……sorry I couldn’t resist! Let’s navigate through...
The Critical Role Of The Trusted Advisor In NetOps
Before there was “Network Operations” there were networks. Networks grew out of a need for connecting one box to another, sharing printers, and for more advanced users,...
Webinar On-Demand: Beyond Monitoring – Introducing SolarWinds Observability Platform
In this webinar, you will discover how SolarWinds® is evolving to deliver complete infrastructure visibility. This webinar examines how to extend visibility across your IT...