Exported Alert – High CPU Cisco Devices
Cisco® IOS also has a command which allows the list of running processes on a Cisco IOS device to display what CPU utilisation is being consumed. This alert leverages this command to work in the same way as the SAM server high CPU load alert. The ability to capture information during the time the issue is being experienced can be invaluable for determining the cause and therefore the resolution, so hopefully, this alert will give you this insight.
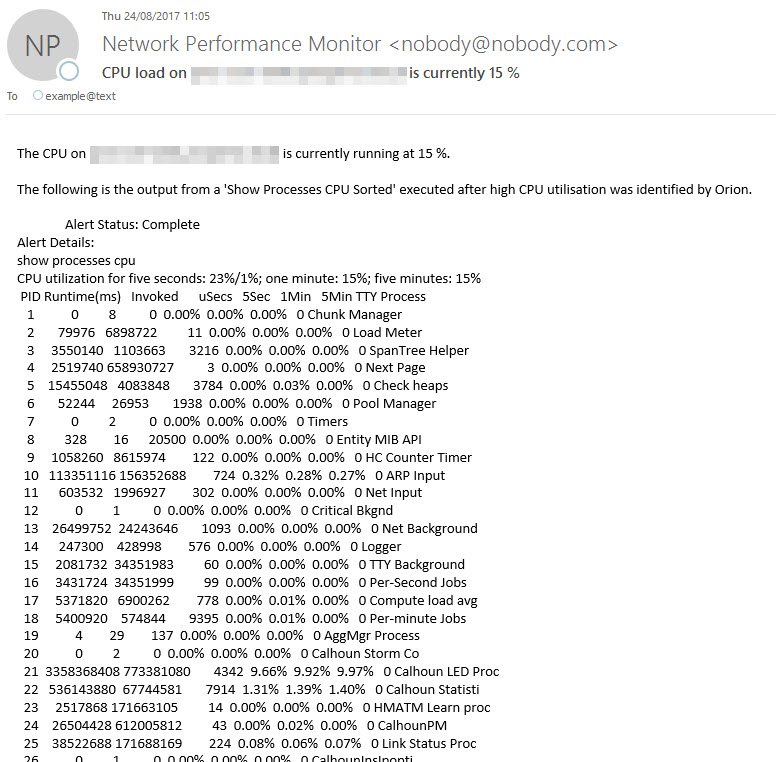
The ‘show processes cpu sorted’ command which is available in privileged mode shows the utilisation of the CPU by the system processes in the last 5 seconds, 1 minute and 5 minutes.
[code]Switch# show processes cpu sorted
CPU utilization for five seconds: 5%/0%; one minute: 6%; five minutes: 5%
PID Runtime(ms) Invoked uSecs 5Sec 1Min 5Min TTY Process
1 4539 89782 50 0.00% 0.00% 0.00% 0 Chunk Manager
2 1042 1533829 0 0.00% 0.00% 0.00% 0 Load Meter
3 0 1 0 0.00% 0.00% 0.00% 0 DiagCard3/-1
4 14470573 1165502 12415 0.00% 0.13% 0.16% 0 Check heaps
5 7596 212393 35 0.00% 0.00% 0.00% 0 Pool Manager
6 0 2 0 0.00% 0.00% 0.00% 0 Timers
7 0 1 0 0.00% 0.00% 0.00% 0 Image Licensing
8 0 2 0 0.00% 0.00% 0.00% 0 License Client N
9 1442263 25601 56336 0.00% 0.08% 0.02% 0 Licensing Auto U
10 0 1 0 0.00% 0.00% 0.00% 0 Crash writer
11 979720 2315501 423 0.00% 0.00% 0.00% 0 ARP Input
12 0 1 0 0.00% 0.00% 0.00% 0 CEF MIB API
<output truncated="">[/code]
*Source Cisco Troubleshooting High CPU Utilization KB
The alert action uses the NCM Execute script to connect and execute the command and will store the results in the Alert ‘Notes’ database field, which can be referenced in any further alert action via the following variable – ${N=Alerting;M=Notes}.
Notes:
- Not all Cisco devices support the ‘show processes cpu sorted’ command and some do not support the sorted parameter. Therefore, you may need to include further filters on the trigger section and/or within the NCM Execute script action remove the ‘sorted’ command parameter.
- The alert contains the definition for inclusion, with the following rules included, which you may want to add to make work for you and your environment:
[code]Cisco IOS value is not empty
Vendor = Cisco
Node Status <> Down
Critical CPU Threshold = True[/code]
The last one, I would like to highlight is an important improvement over the default High CPU alert within Orion, as this references the assigned critical threshold for each individual device and is not based on a singular value i.e. greater than 90%.
3. Adjust the Do Not Trigger condition to suit your needs. Currently, the 620 seconds ensures at least 2 polls are included in the analysis based on default polling frequencies.
Custom Alert: High CPU Cisco Devices

Mark Roberts
Technical Director
Custom Alert: High CPU Cisco Devices
Don’t get lost! Mapping your Network with SolarWinds
Heard of SolarWinds Intelligent Maps and never known where to start with them? You’re in luck! Join us as we chart a course……sorry I couldn’t resist! Let’s navigate through...
The Critical Role Of The Trusted Advisor In NetOps
Before there was “Network Operations” there were networks. Networks grew out of a need for connecting one box to another, sharing printers, and for more advanced users,...
Webinar On-Demand: Beyond Monitoring – Introducing SolarWinds Observability Platform
In this webinar, you will discover how SolarWinds® is evolving to deliver complete infrastructure visibility. This webinar examines how to extend visibility across your IT...