How To Use Time Filters In SolarWinds Reports
Reporting on the availability, performance and capacity of your network is just as important as the metrics displayed on a live dashboard. Reports enables you to share the network status, and health, with the right people in your organization, to collaborate on taking actions.
Any good reporting engine should easily facilitate reports that cover a defined time period. One very useful scenario is reporting on the network’s behaviour during business hours and out of hours. Such a report helps you to spot abnormal metrics, or growth, based on the expected IT activity for that period.
SolarWinds® Orion platform provides the capability to display data based on a defined day/time range. You can define such a range using;
- Filters based on weekdays (i.e. Sunday, Monday…) and time
- A certain date/time (i.e. 15/03/2019 07:00 – 10:00)
Network Latency Nightly Report
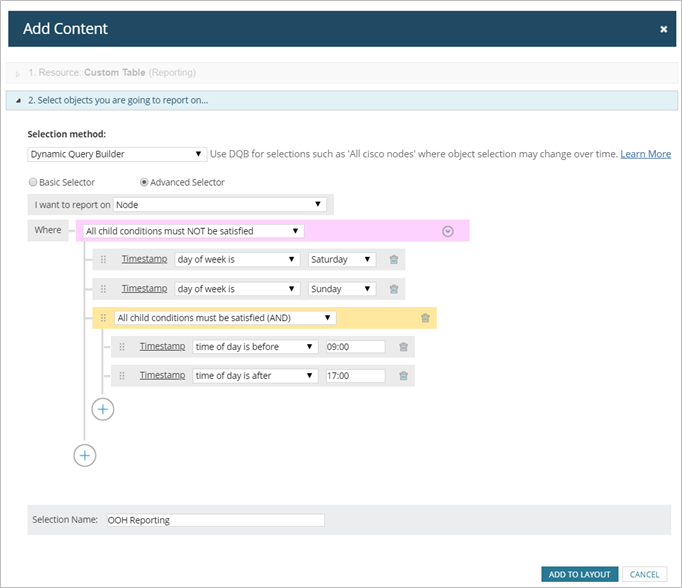
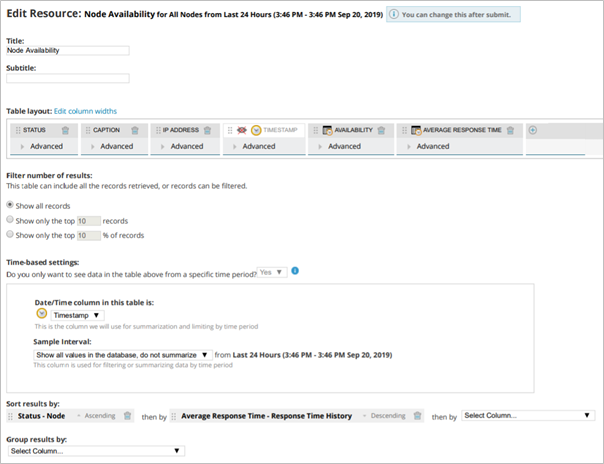
One example is reporting on the latency (response time) of critical devices, in a remote data centre, that are part of a nightly batch job. We want to see how the network behaves during certain times of the day and week and not have historic data for periods of time outside of this clouding our visibility.
Start by creating a new report and make sure to select the below filters in the Add Content page.
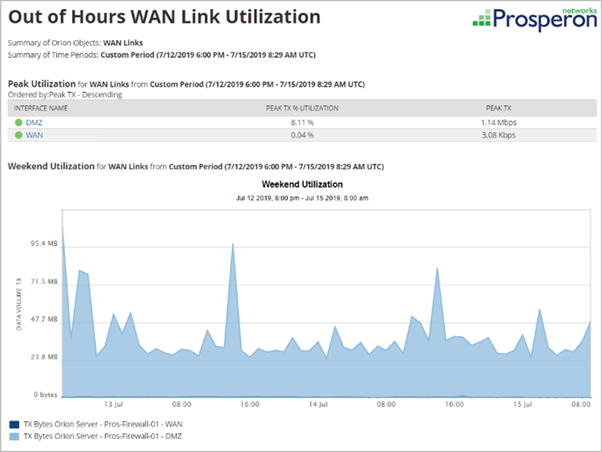
Weekend WAN Utilization
Another example is internet link utilization at night when you’re transferring your backups to the cloud. Such a report will provide actionable insight, from the network perspective, into your backup strategy. This brings focus to the report output either showing the behaviour you are actually interested in, or excluding data which is not desired in the output.
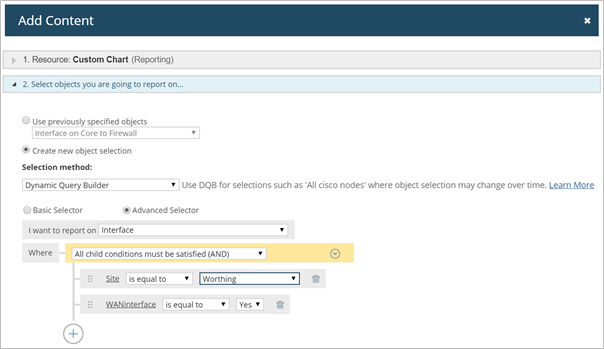
Make sure to select the relevant interfaces in Add Content.
In this scenario, we opted to for a dynamic filter and utilised pre-populated custom properties that enabled us to instantly determine devices and interfaces we wanted to report on.
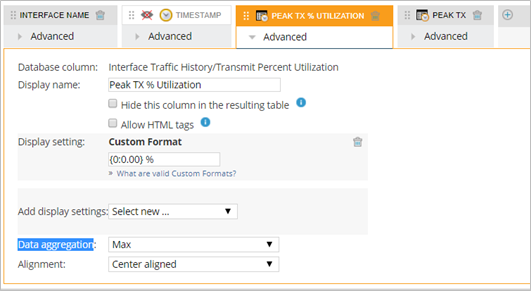
Note: The data aggregation for Transmit Percent Utilization is set to Max to reflect the highest bandwidth consumption on the link and the Custom Format is stating I want to see only positive numbers, up to 2 decimal places and with a % sign on the end.
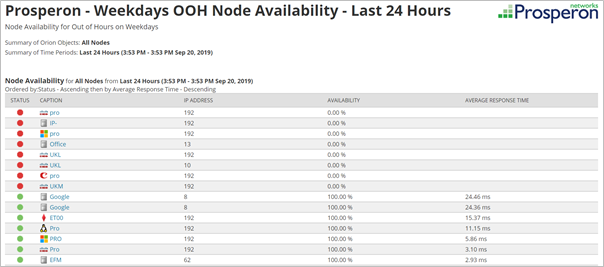
Custom Report: Weekdays OOH Node Availability Last 24 Hours

Abdullah Kamal
Senior SolarWinds Field Engineer
Abdullah is a Senior SolarWinds Field Engineer at Prosperon Networks. As a SolarWinds Engineer for over two years, Abdullah has helped hundreds of customers meet their IT monitoring requirements with SolarWinds.
Custom Report: Weekdays OOH Node Availability Last 24 Hours
Managing the Challenge: Time, Resource, Knowledge, and Budget
‘’I am the only person that manages our SolarWinds platform, and staying on top of……… is a challenge" Above, is a statement that is common for us to hear, and if you can...
Webinar On-Demand: SolarWinds Best Practices – Out-of-the-Box Vs. Custom Reports
In this webinar, you will discover how to enhance SolarWinds® by going beyond default reports. This webinar examines how to improve the efficiency of your platform by going...
An Introduction To SolarWinds Best Practices – Custom Alerts
Even outside of the IT world, the first thing that many people think of when you hear the term 'monitoring' is alerts. Whether it be a flashing light, a siren, or in the...

